PHONE: 604-925-1175
|
EMAIL:
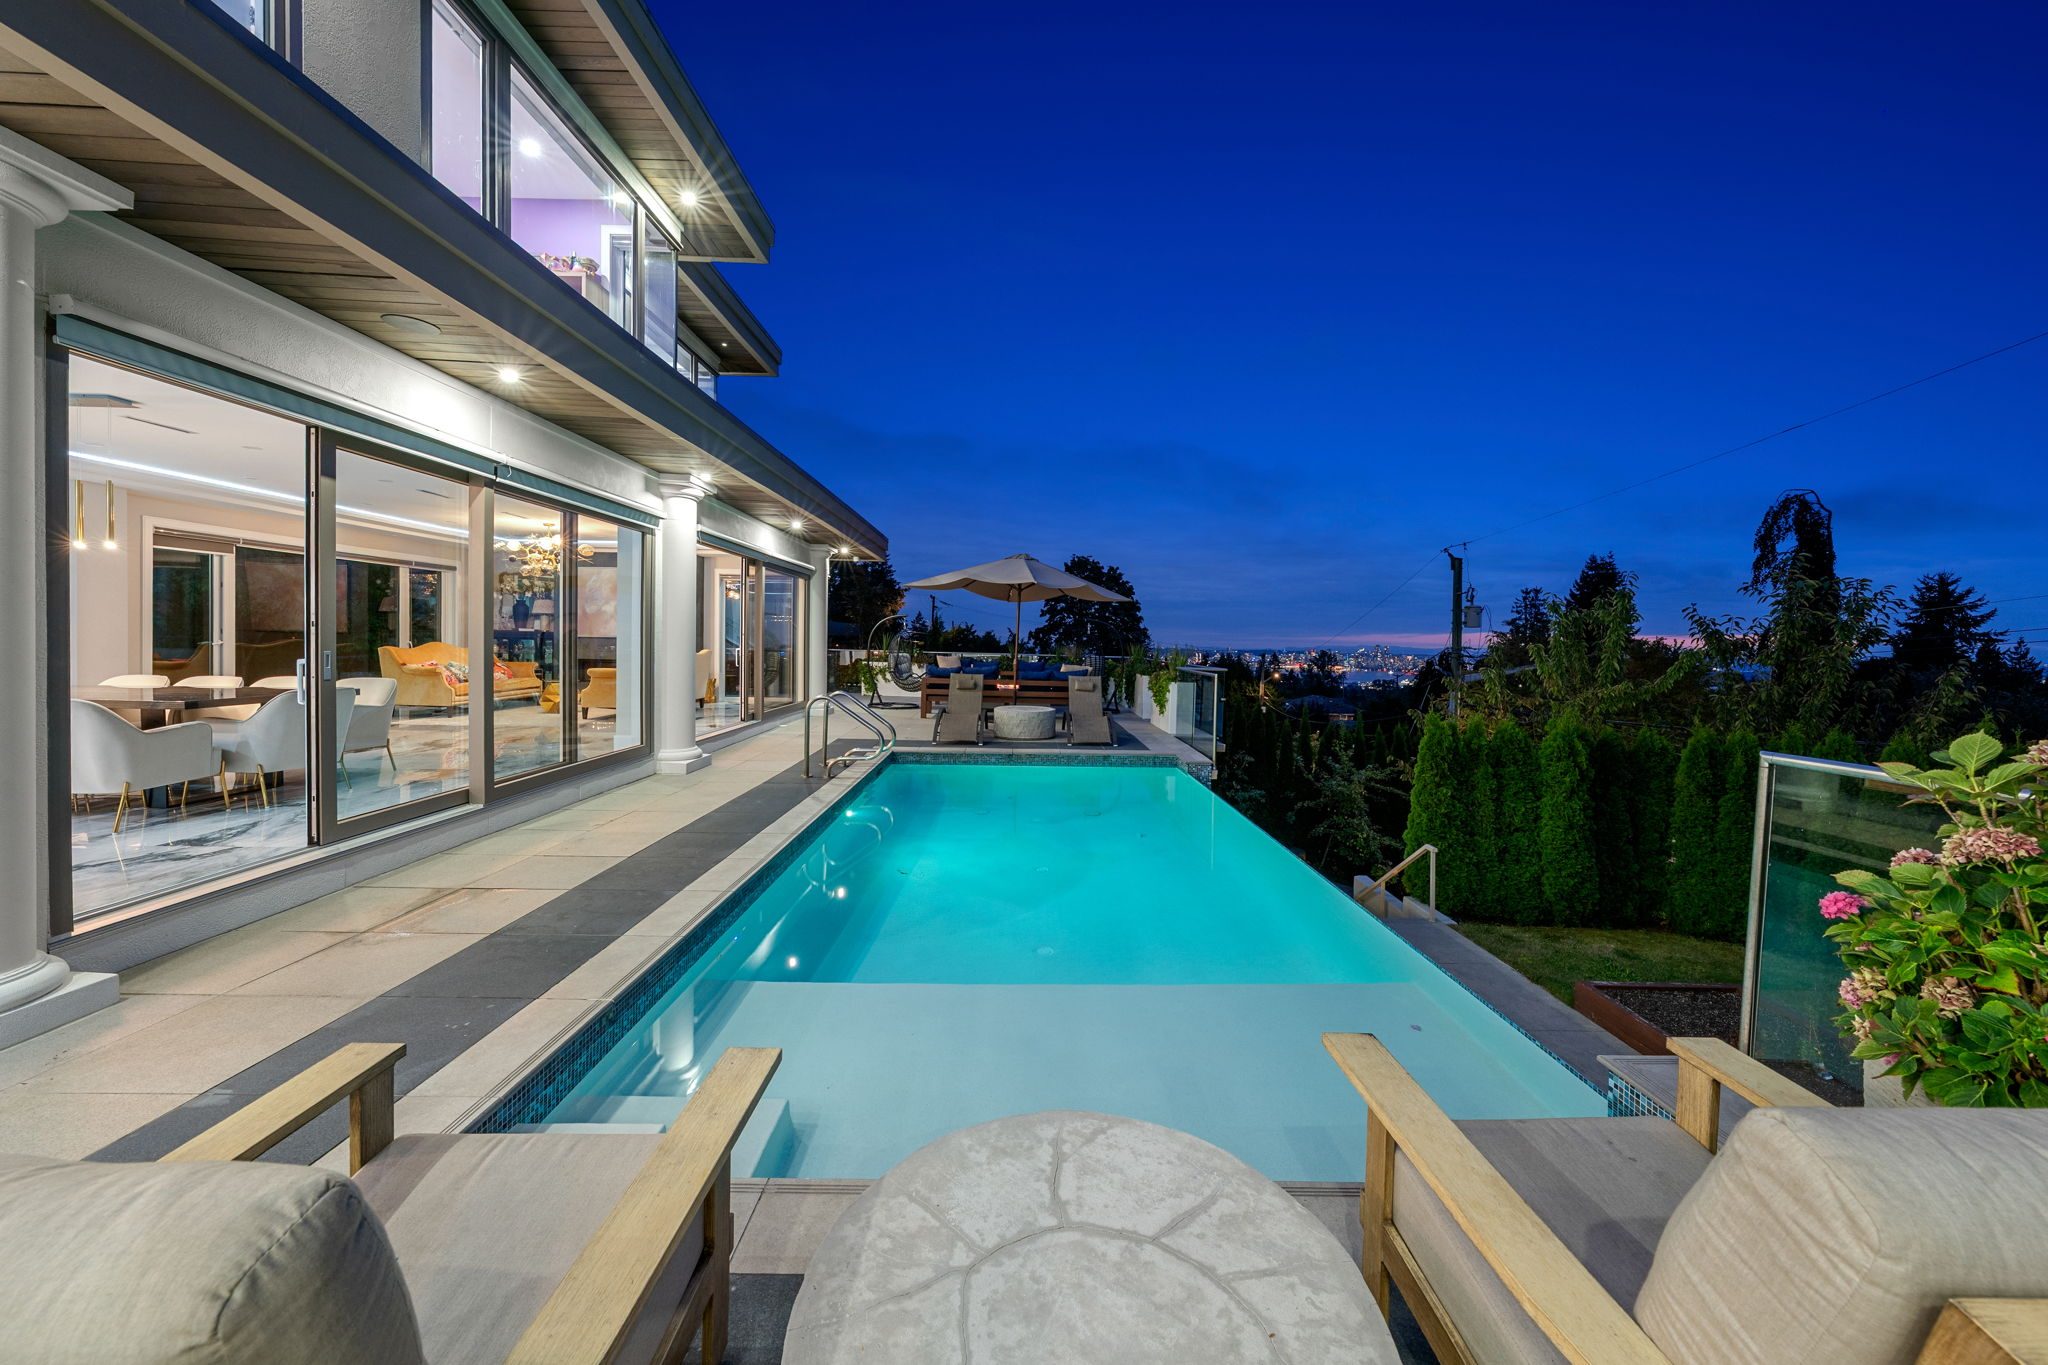
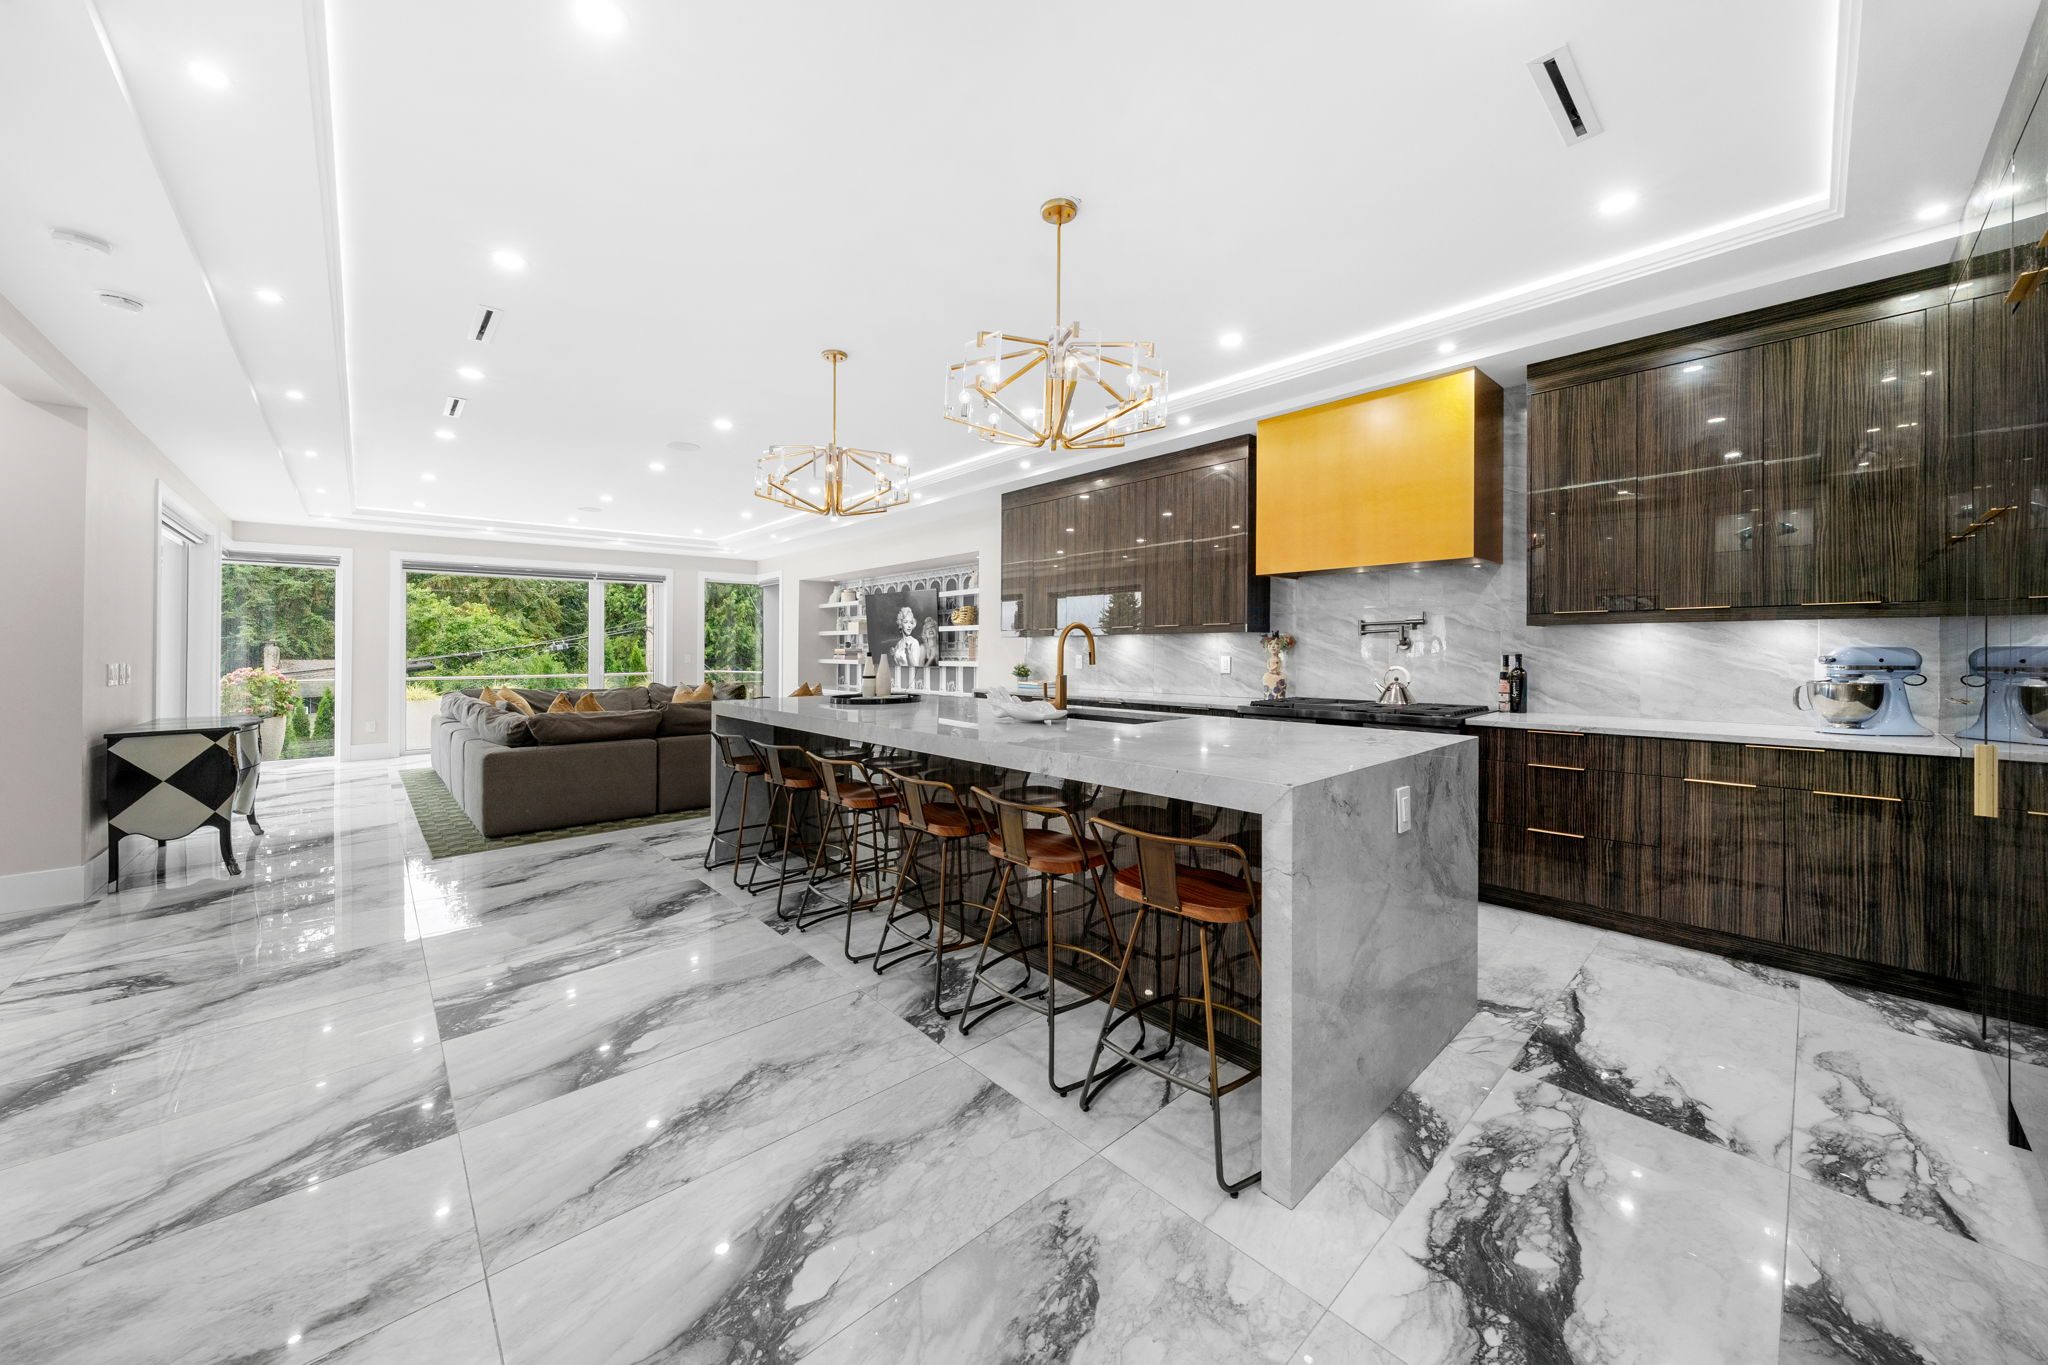
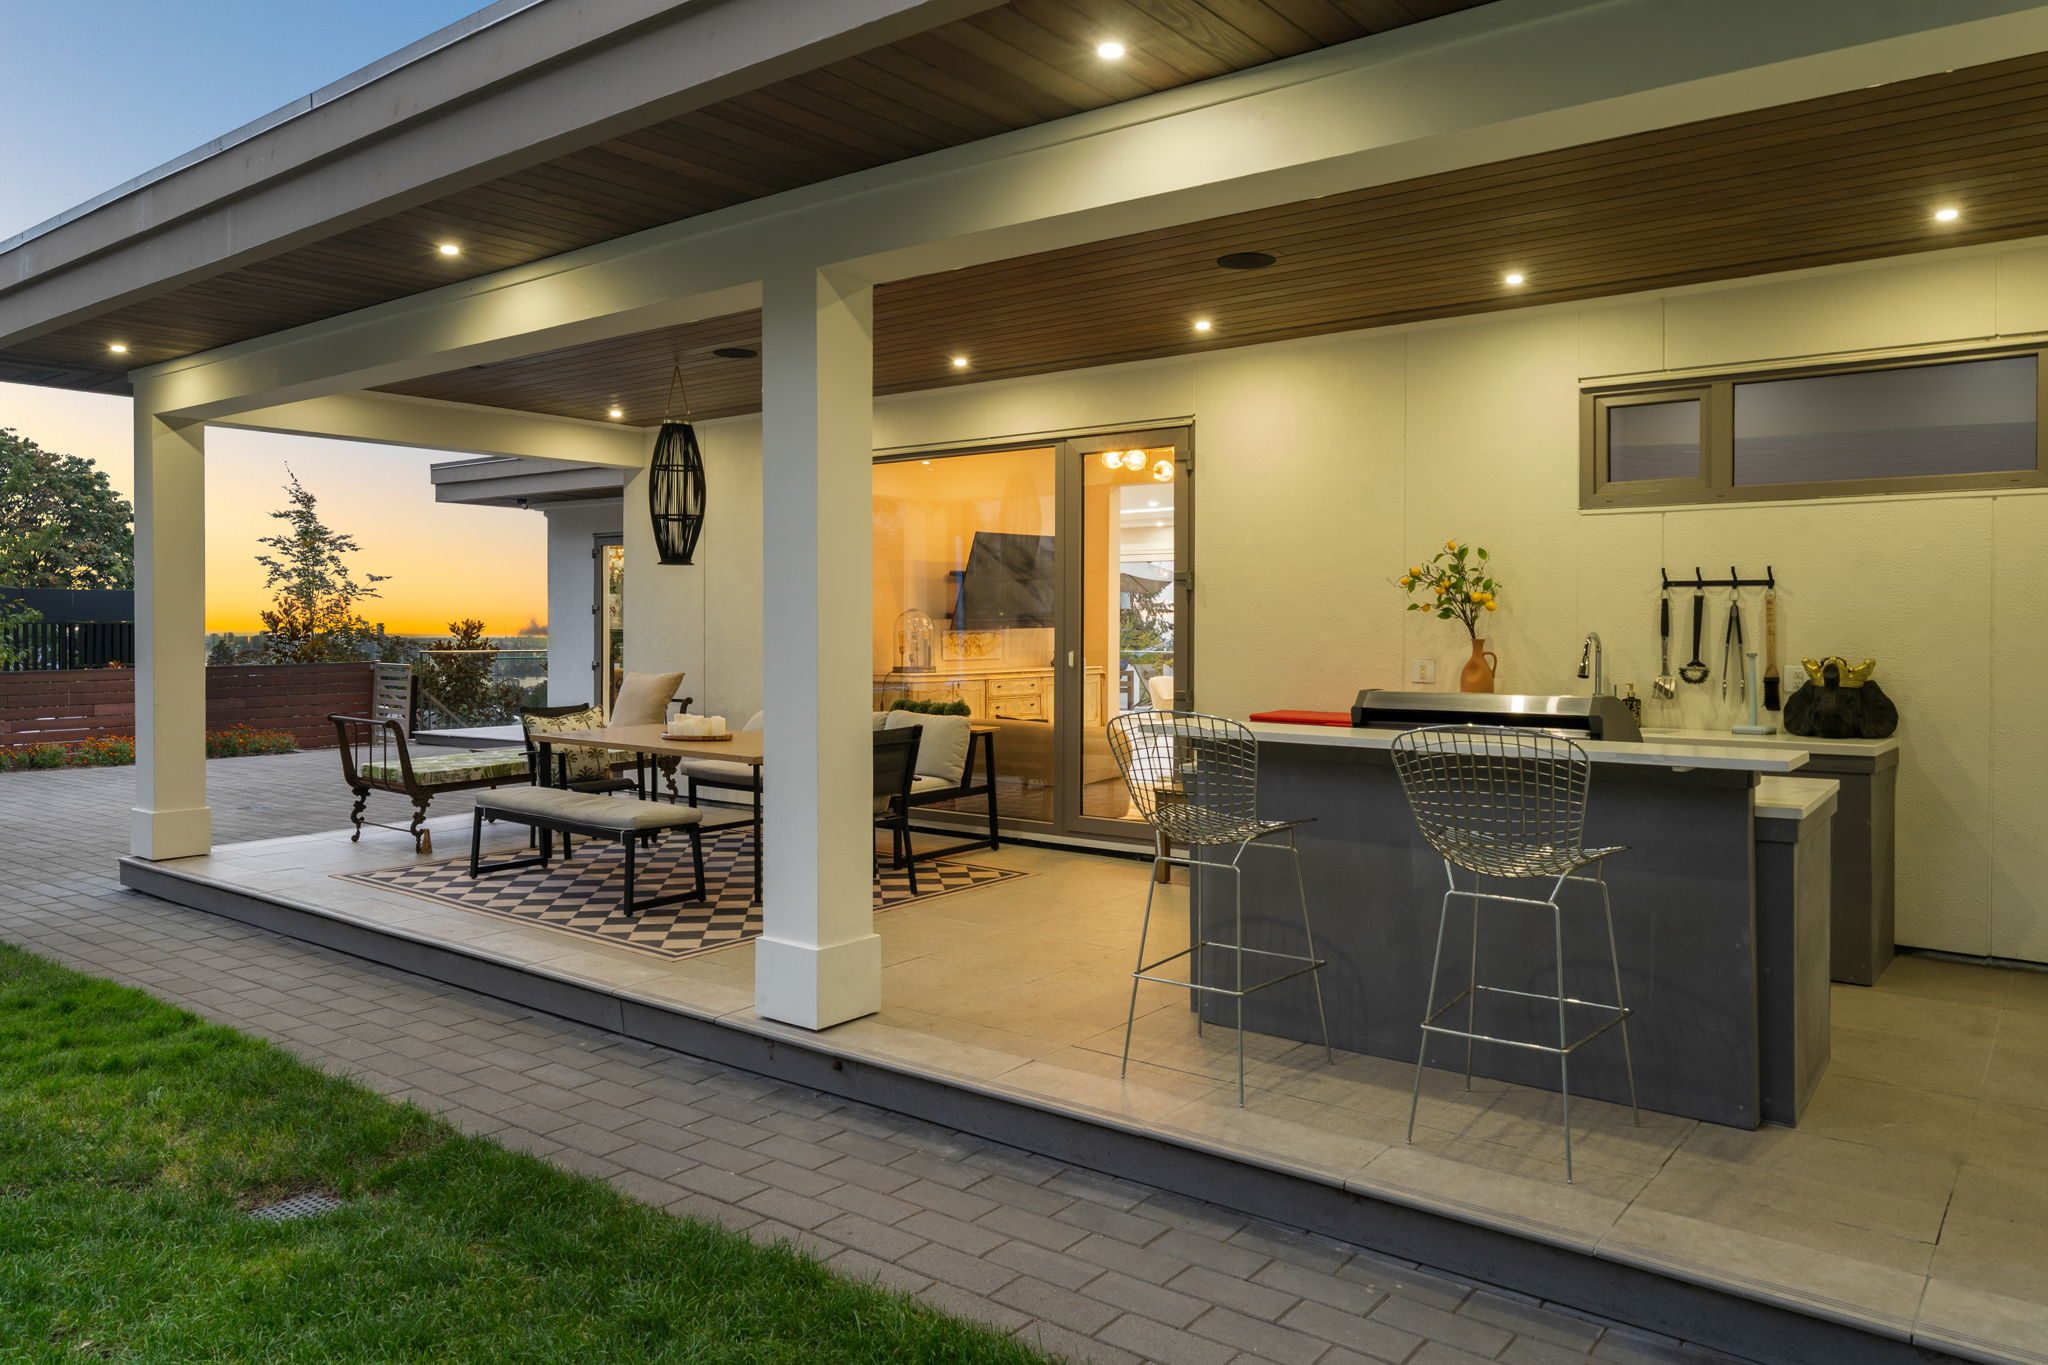
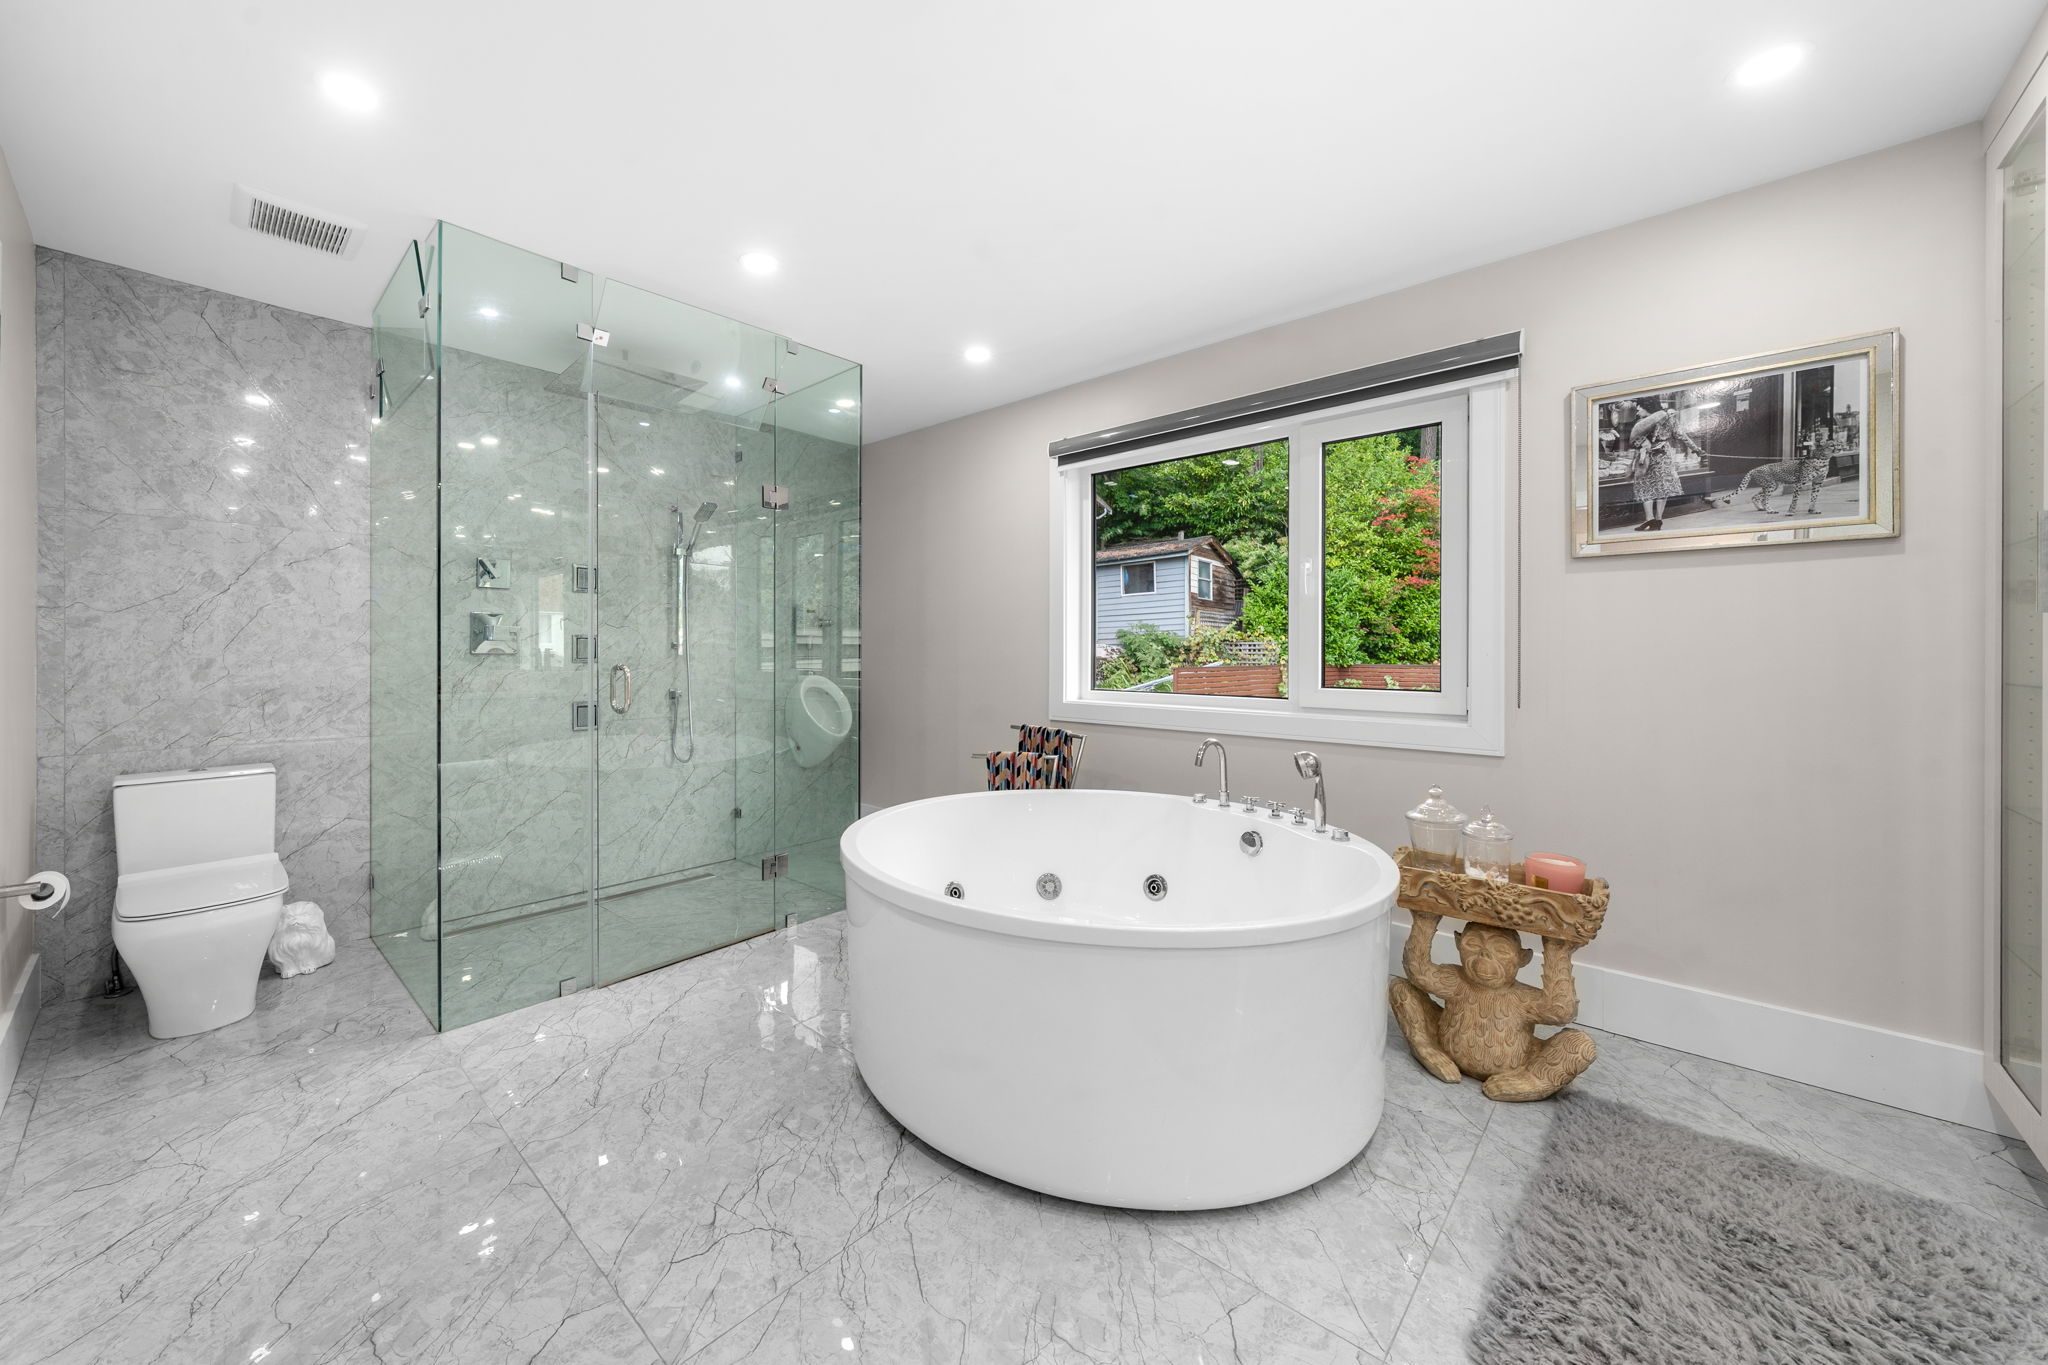
 View the Floor Plan
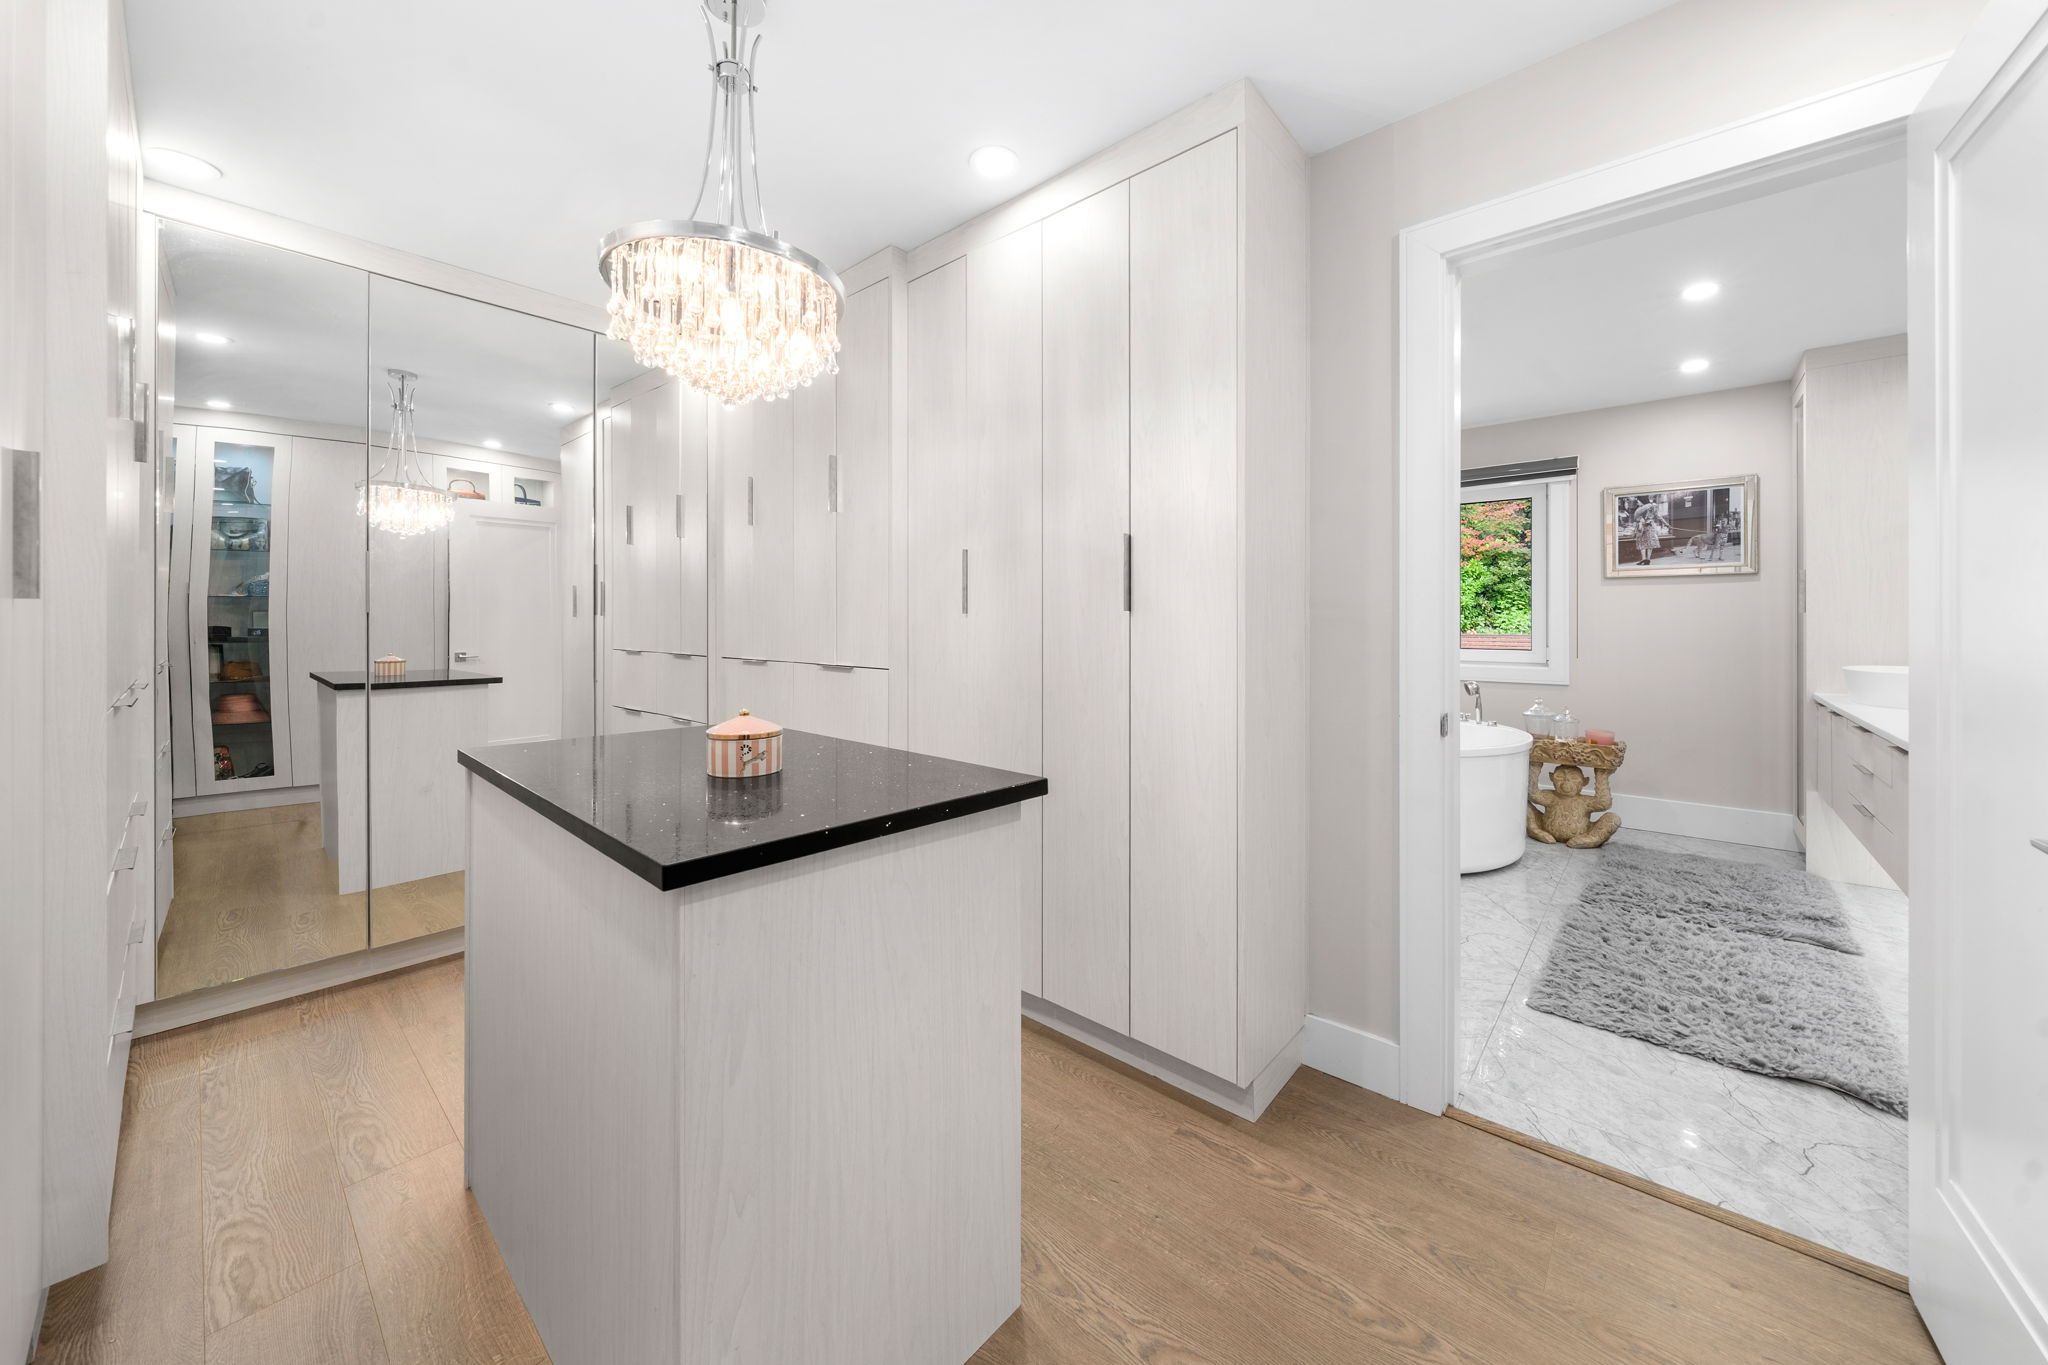
Room layout for this home
Open →
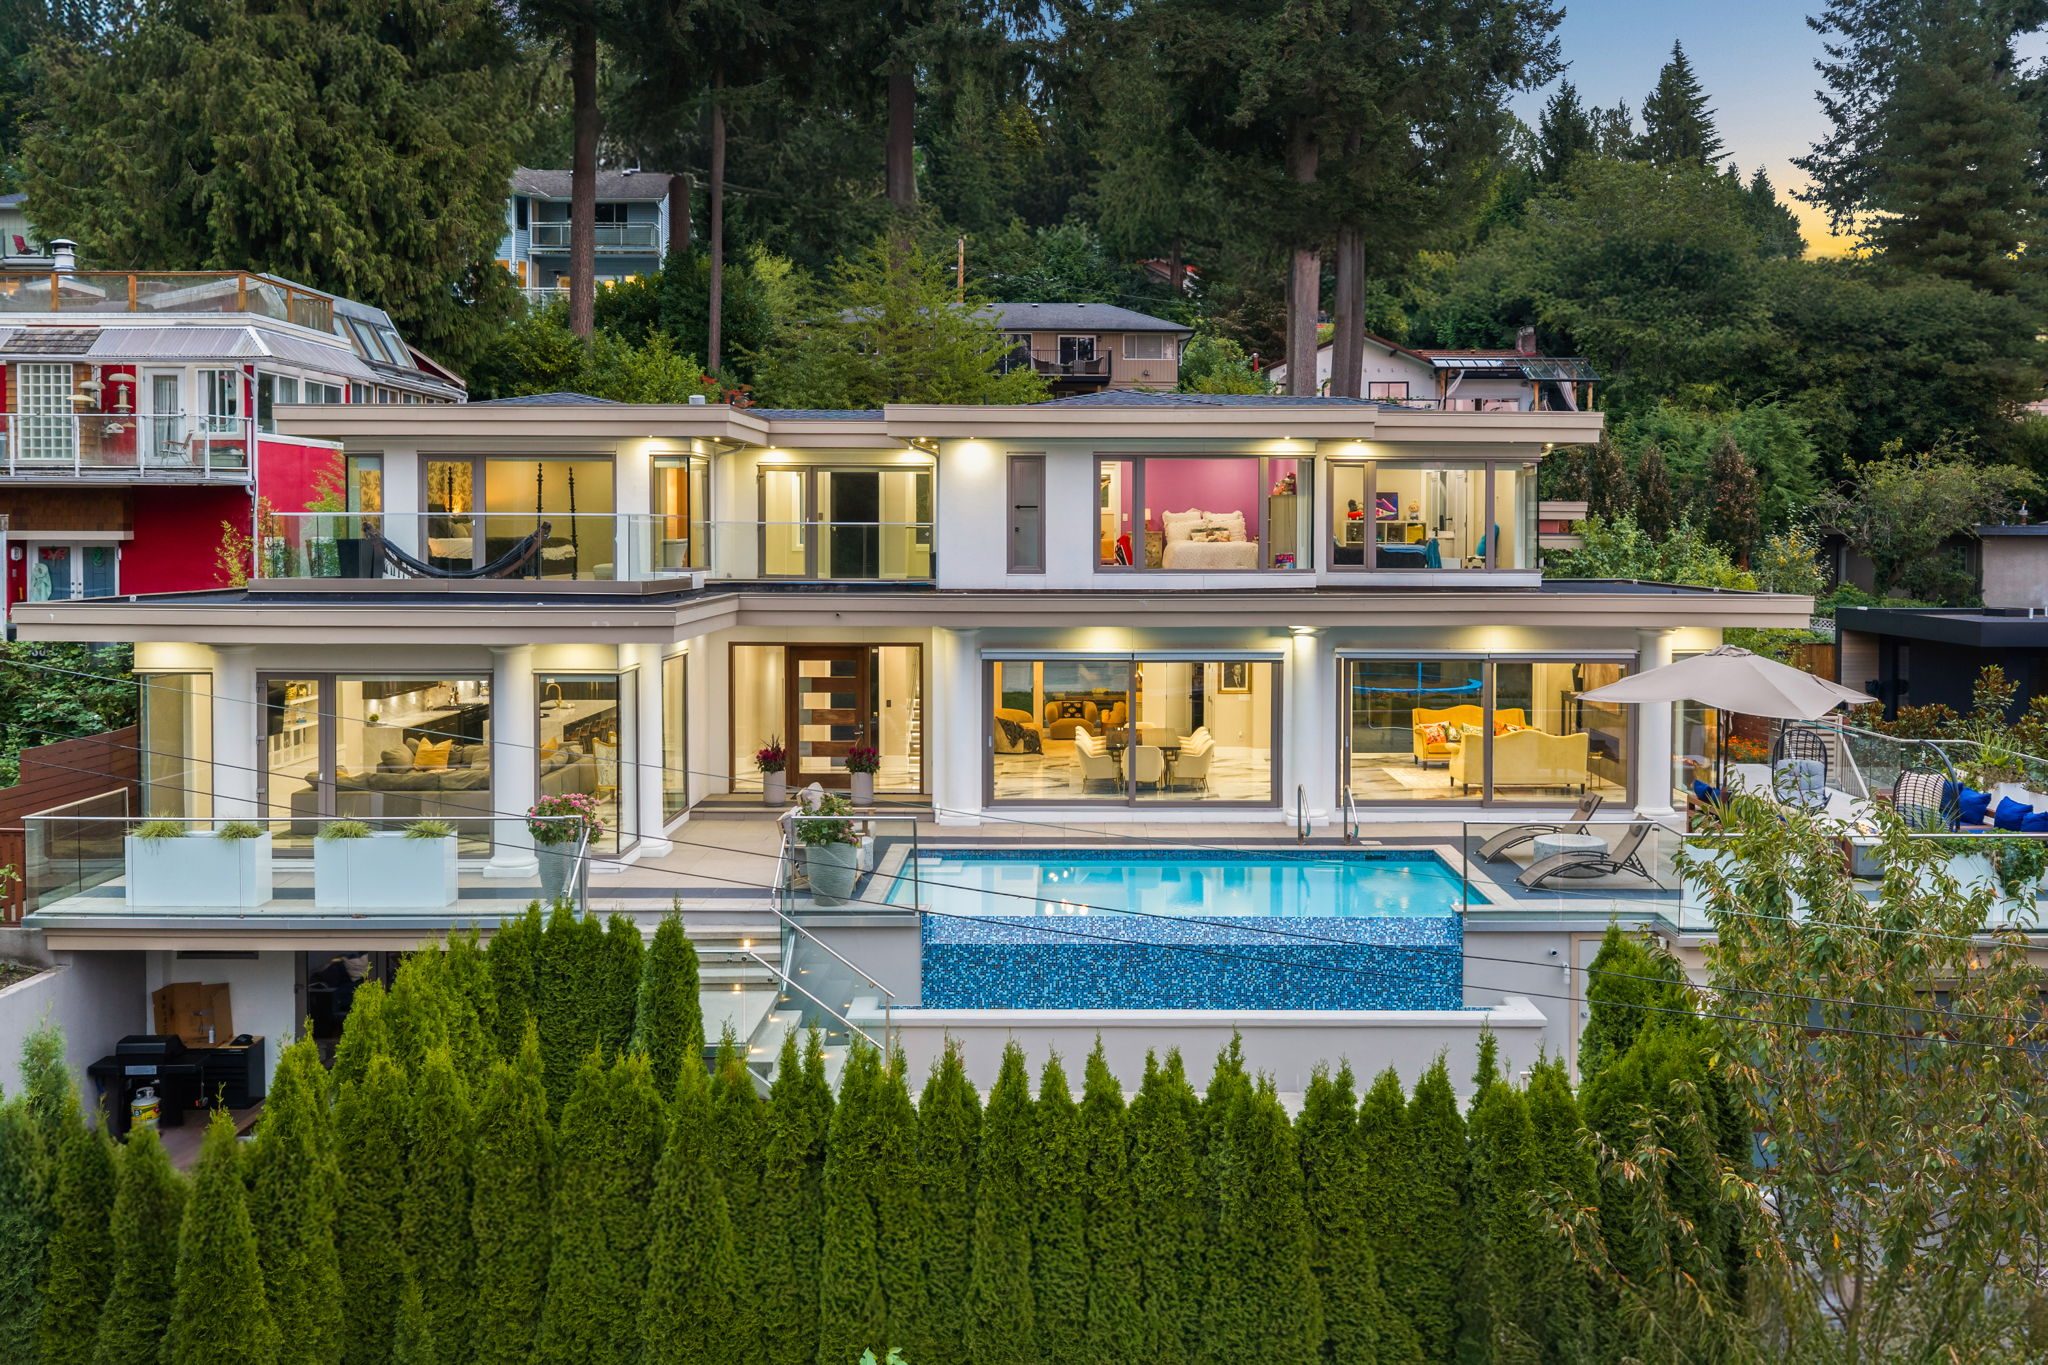
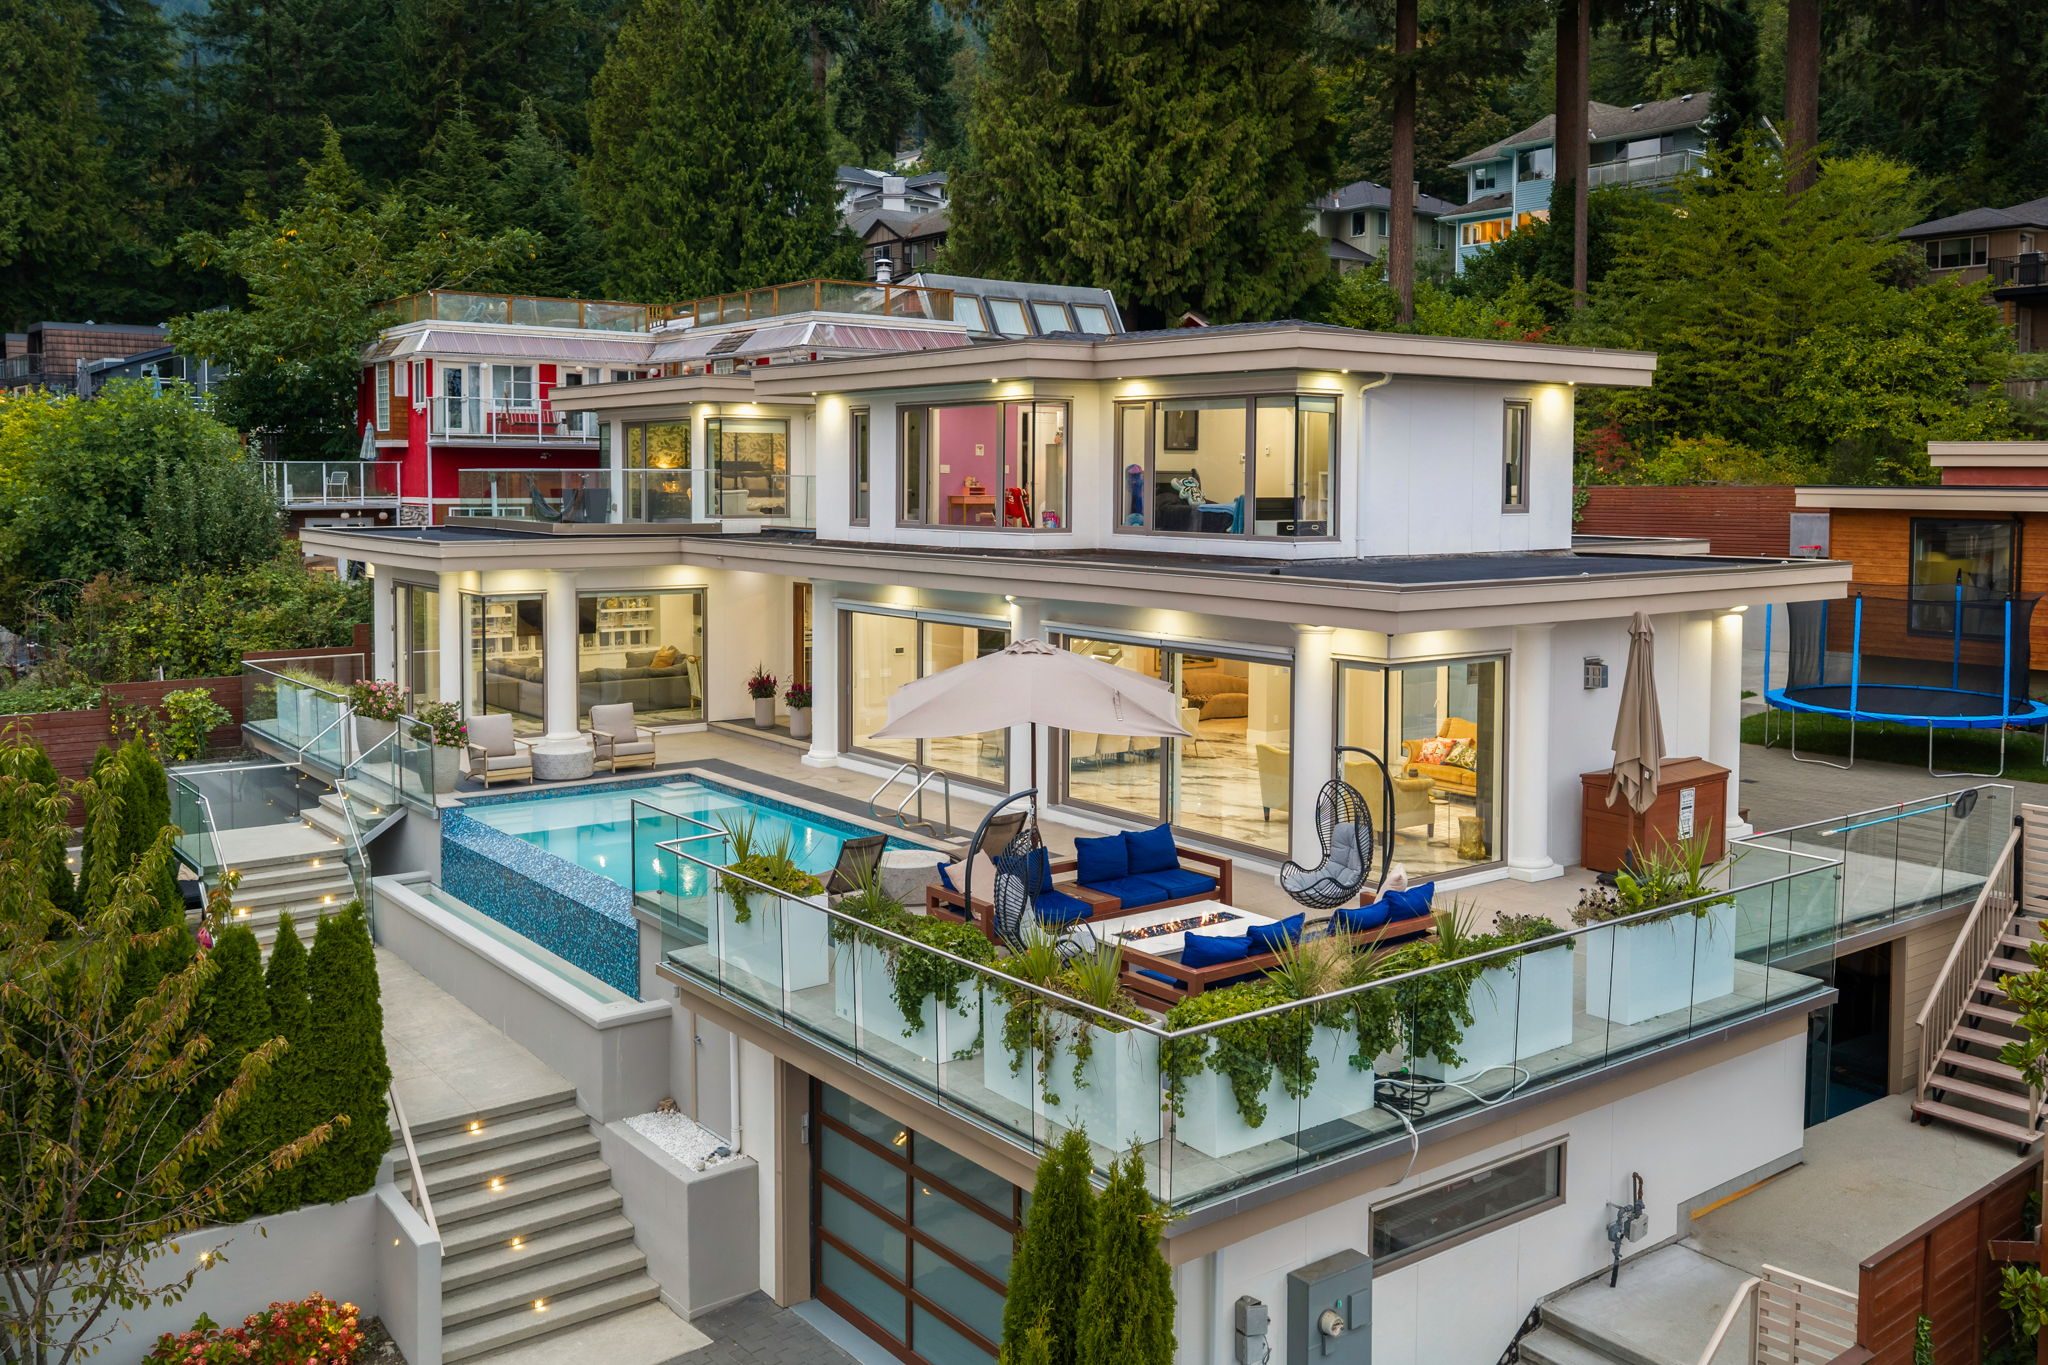
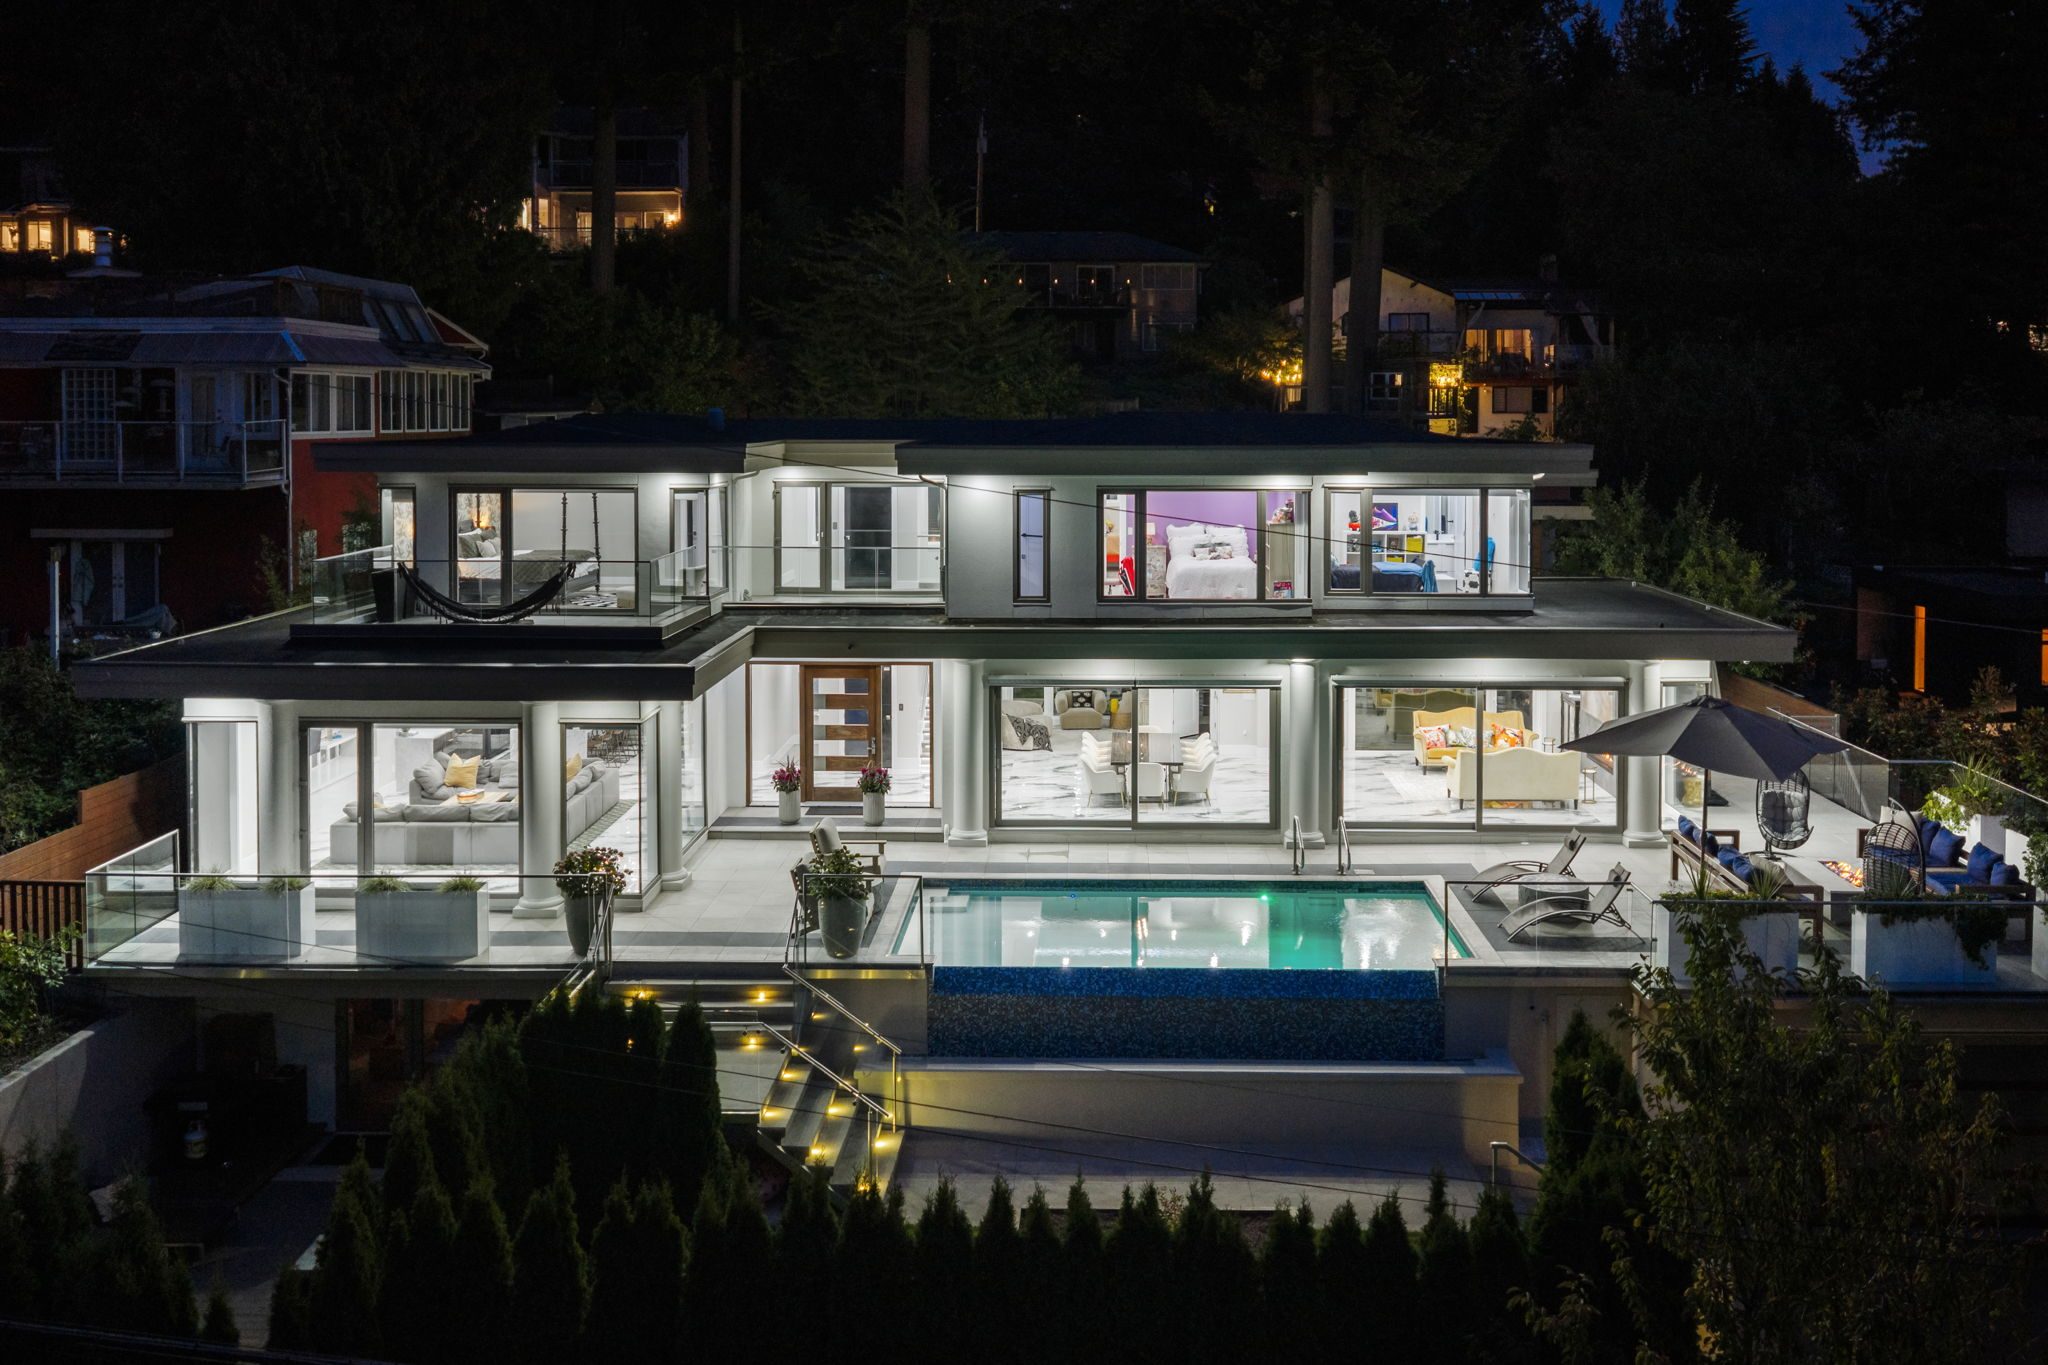
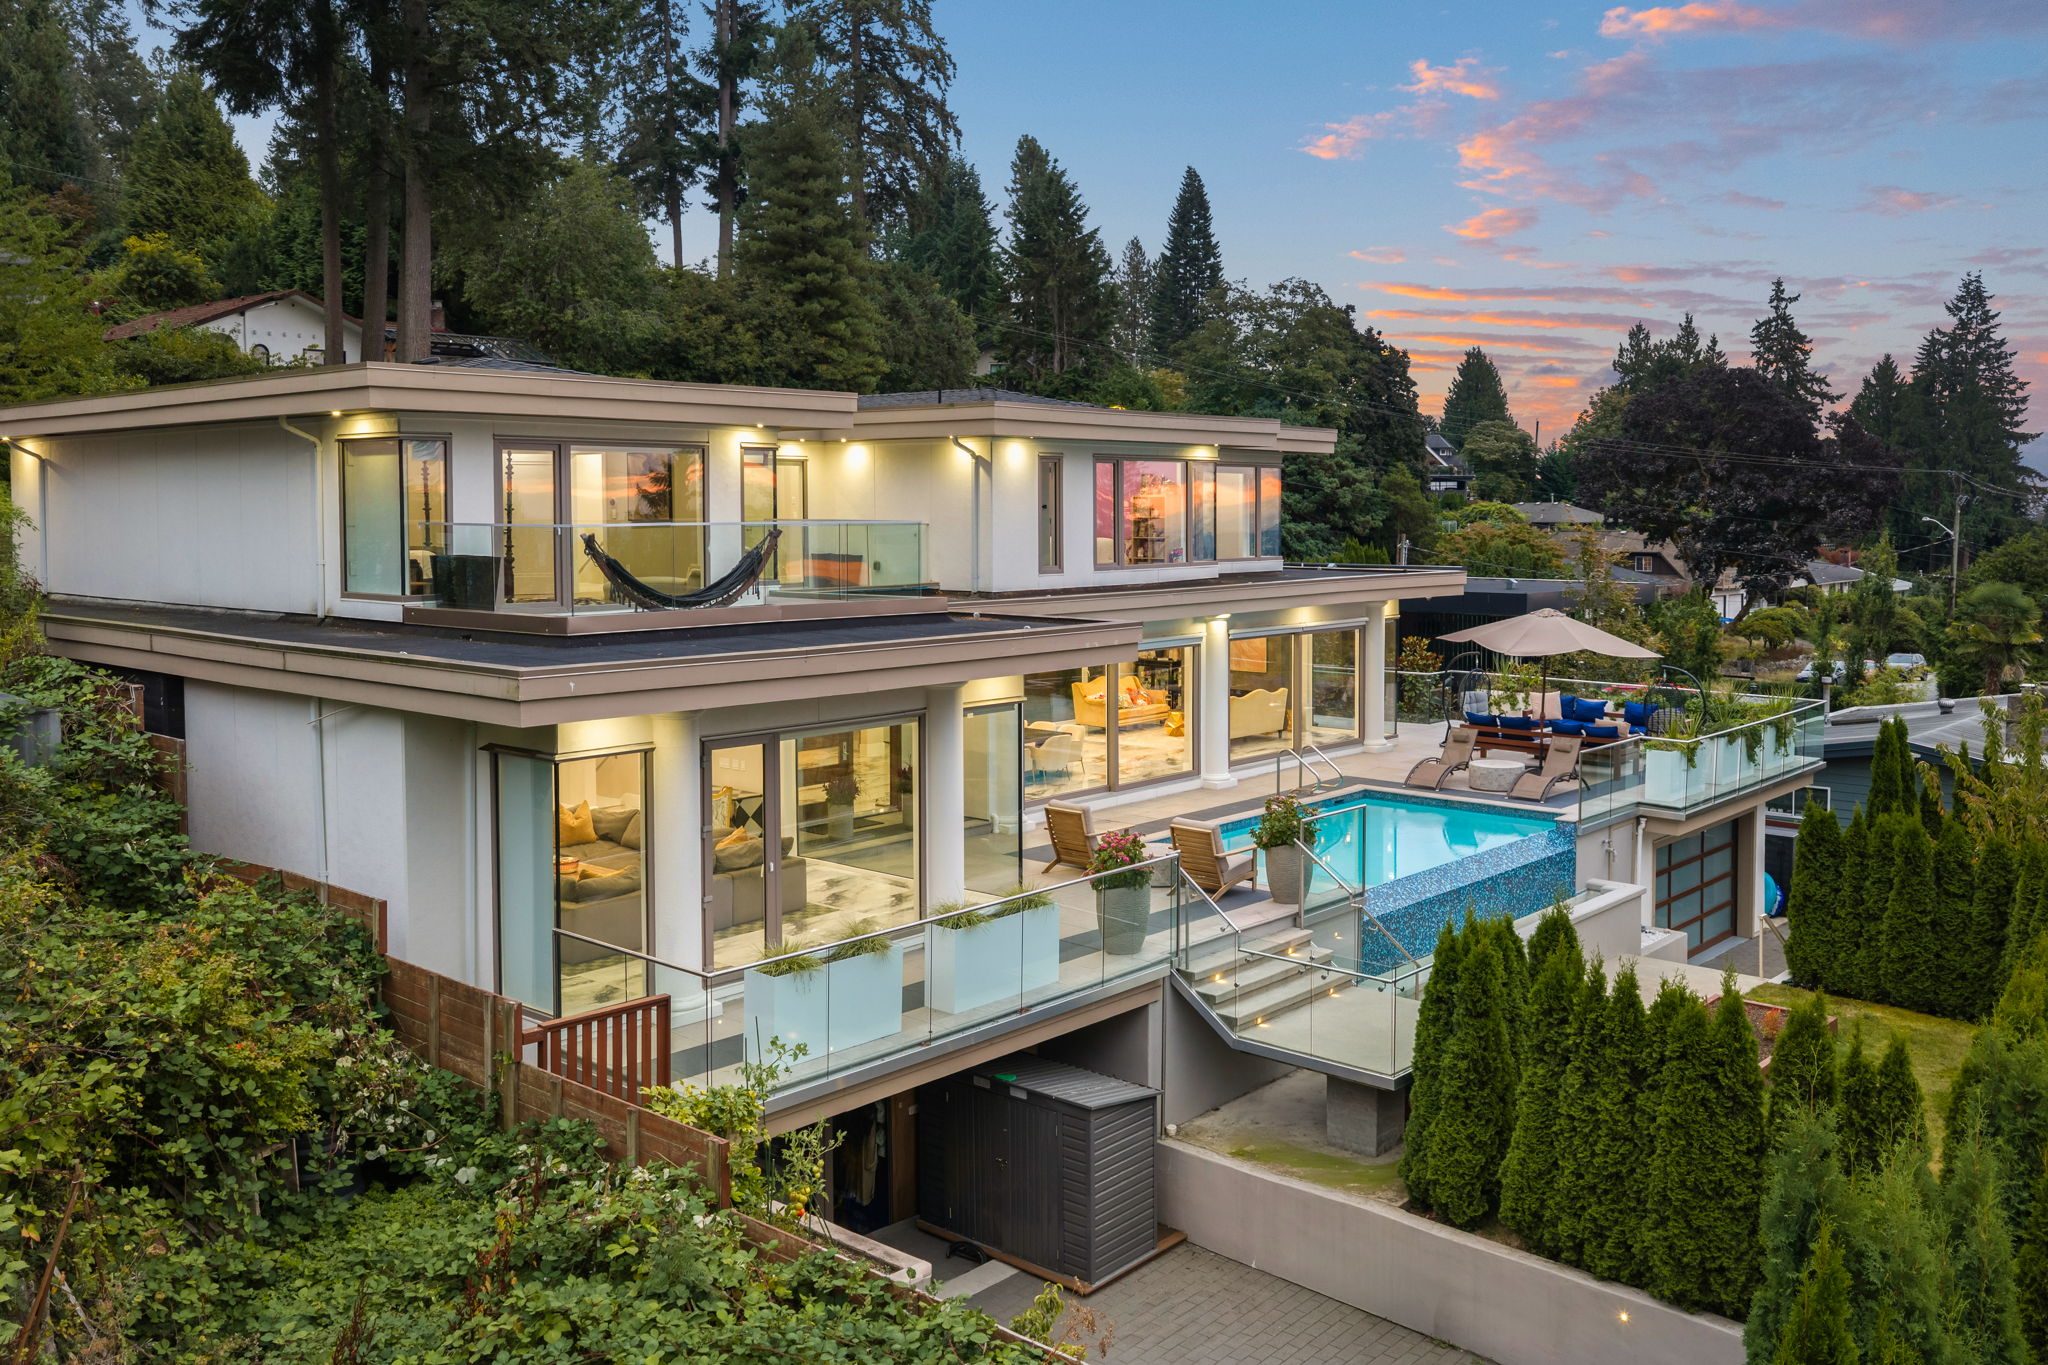
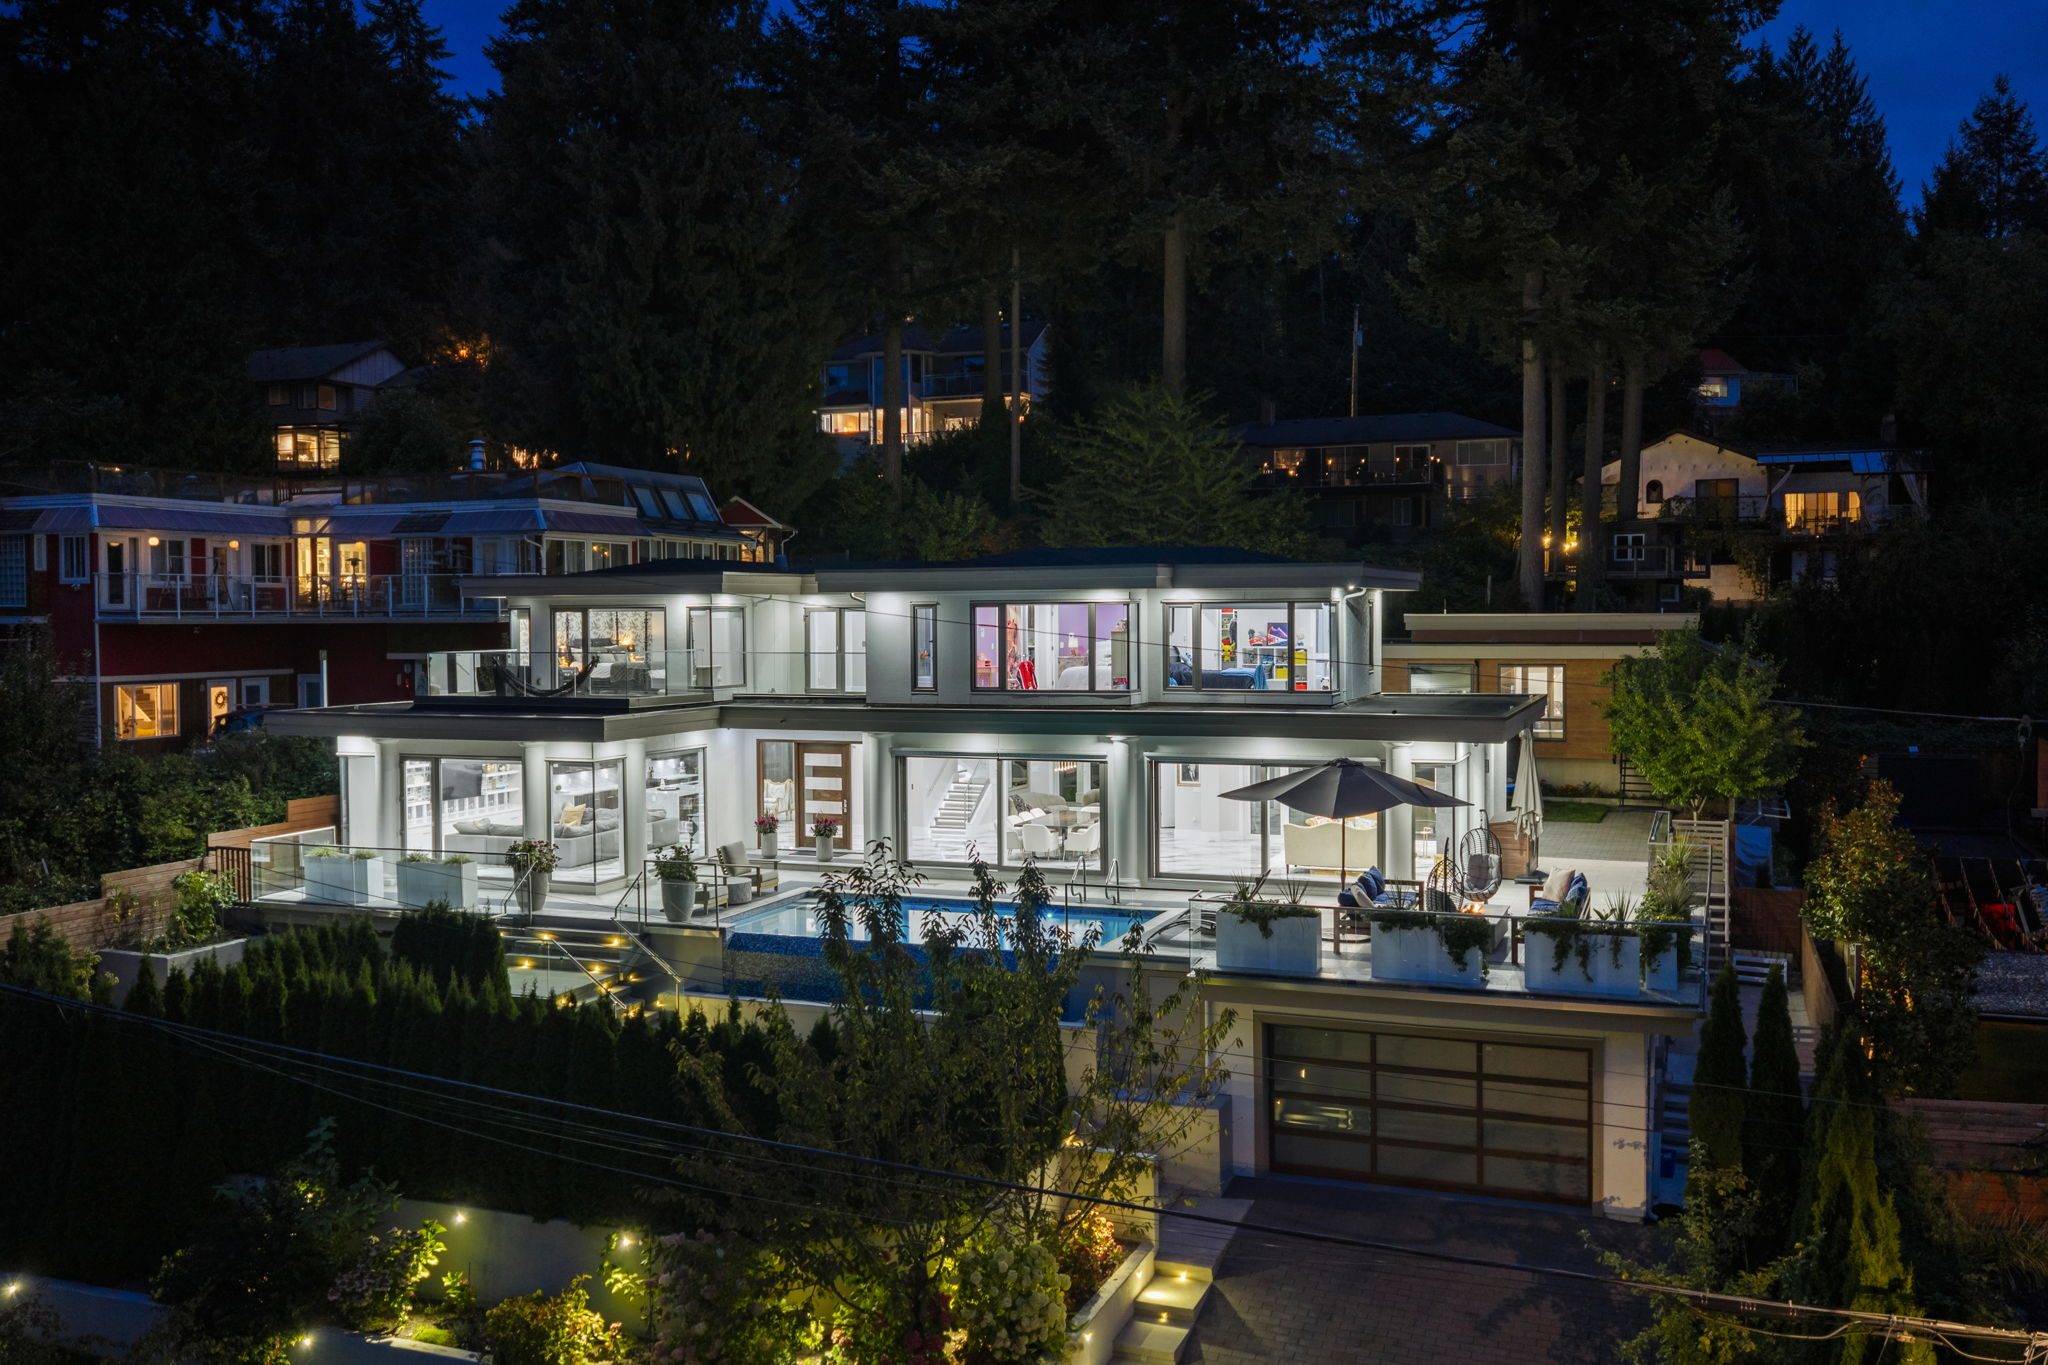
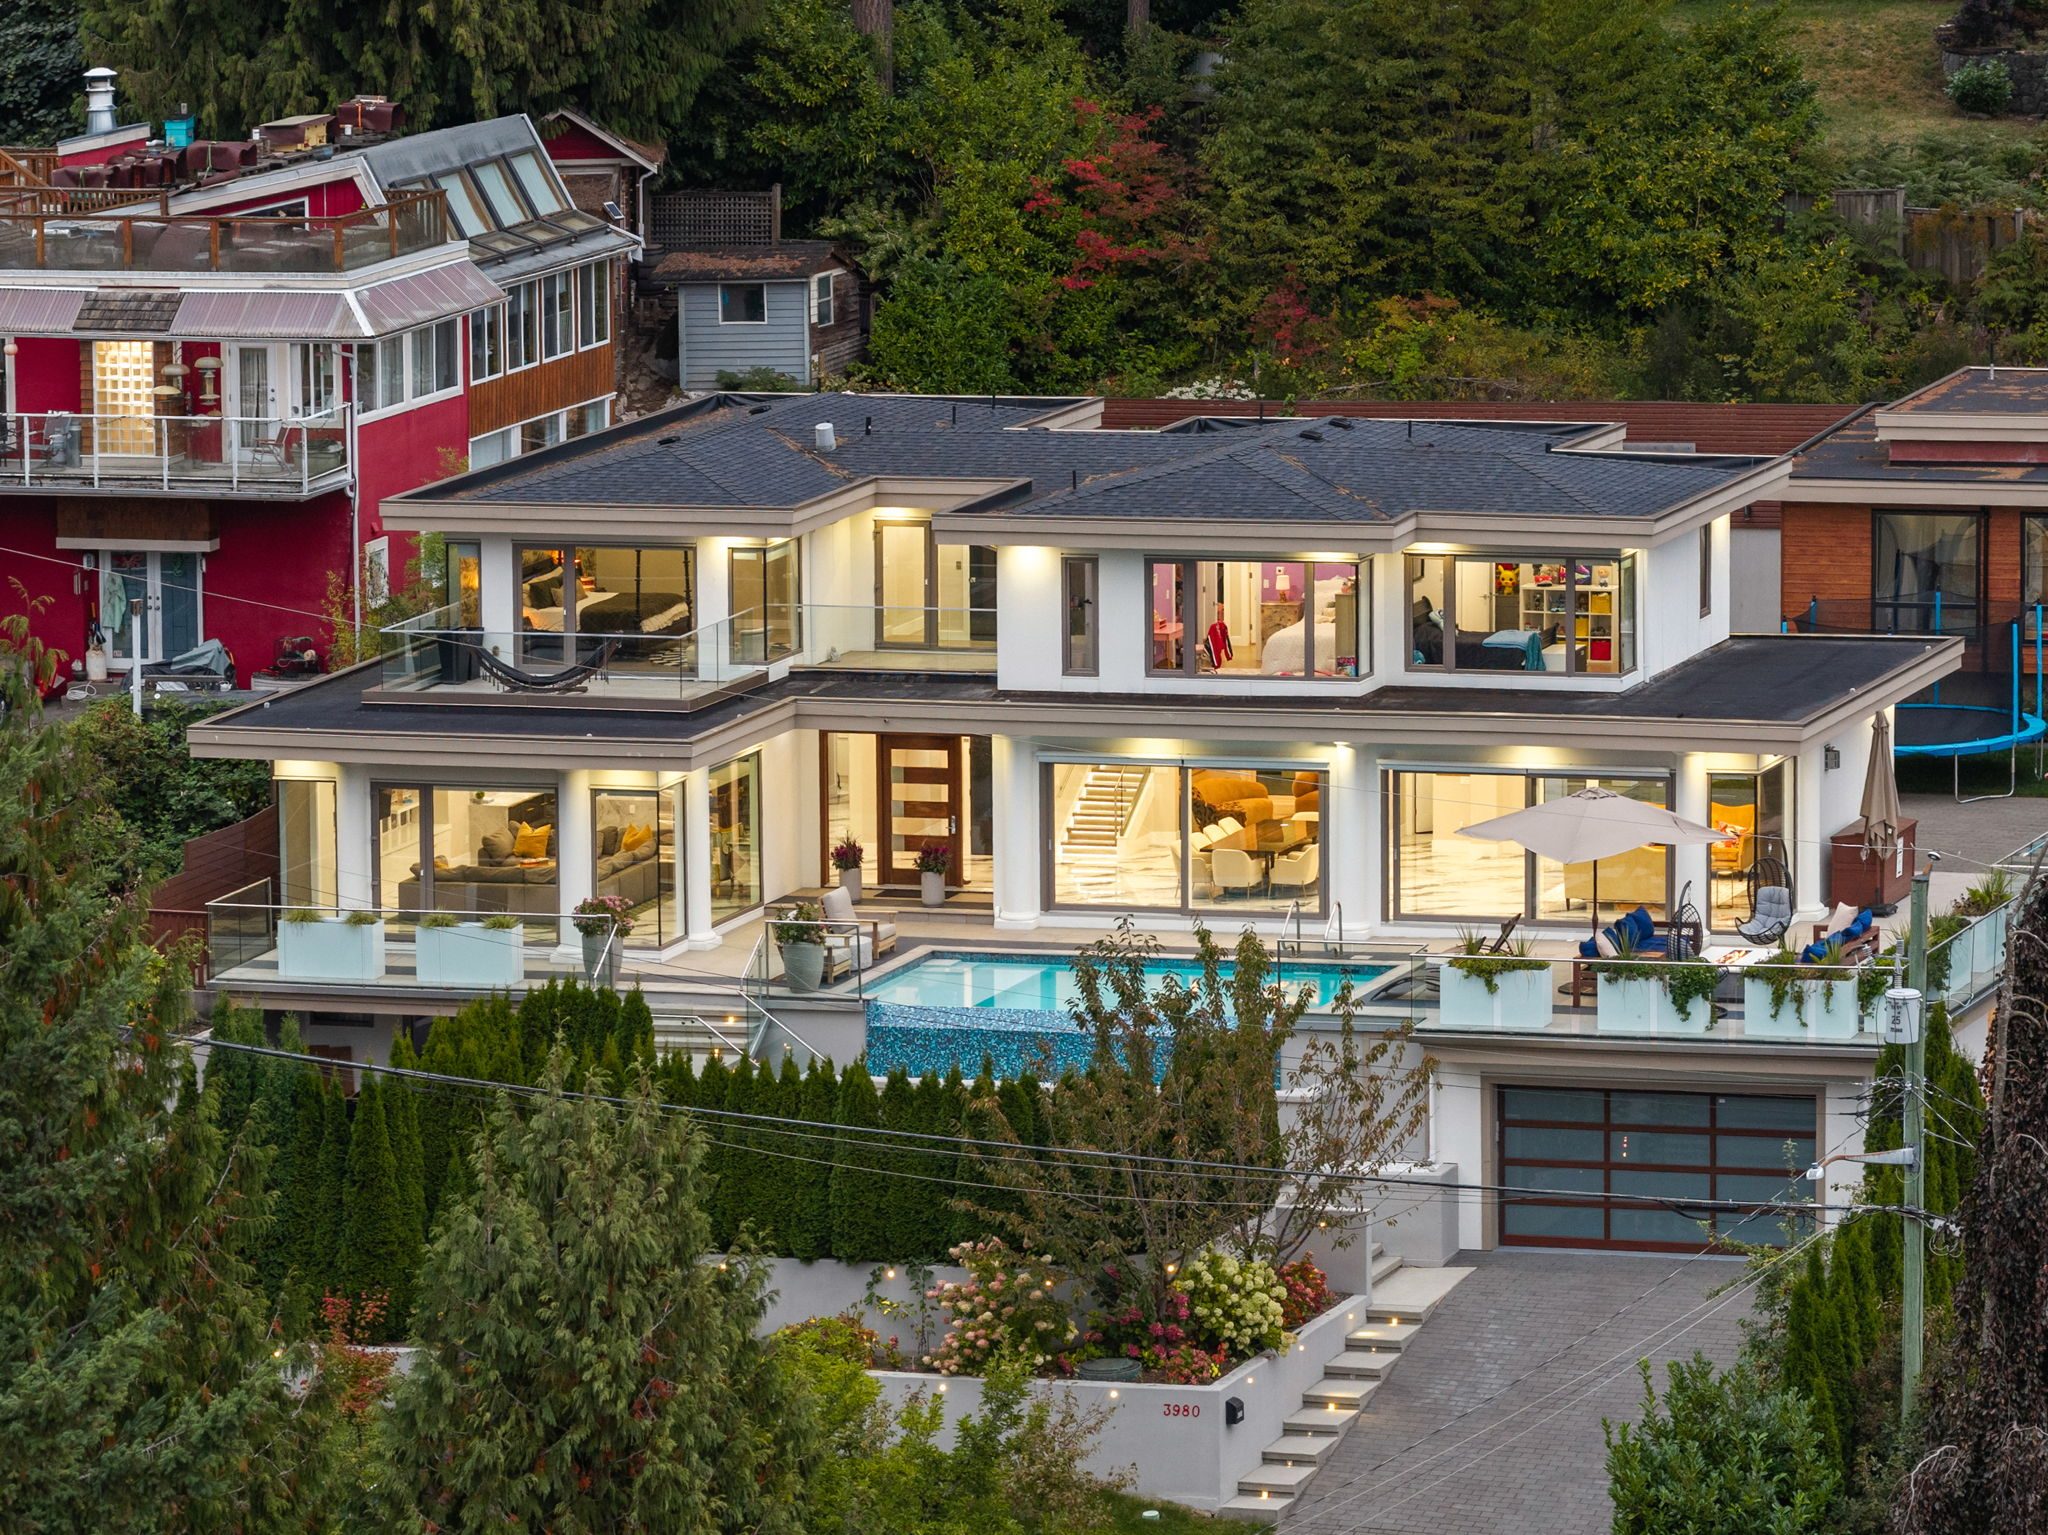
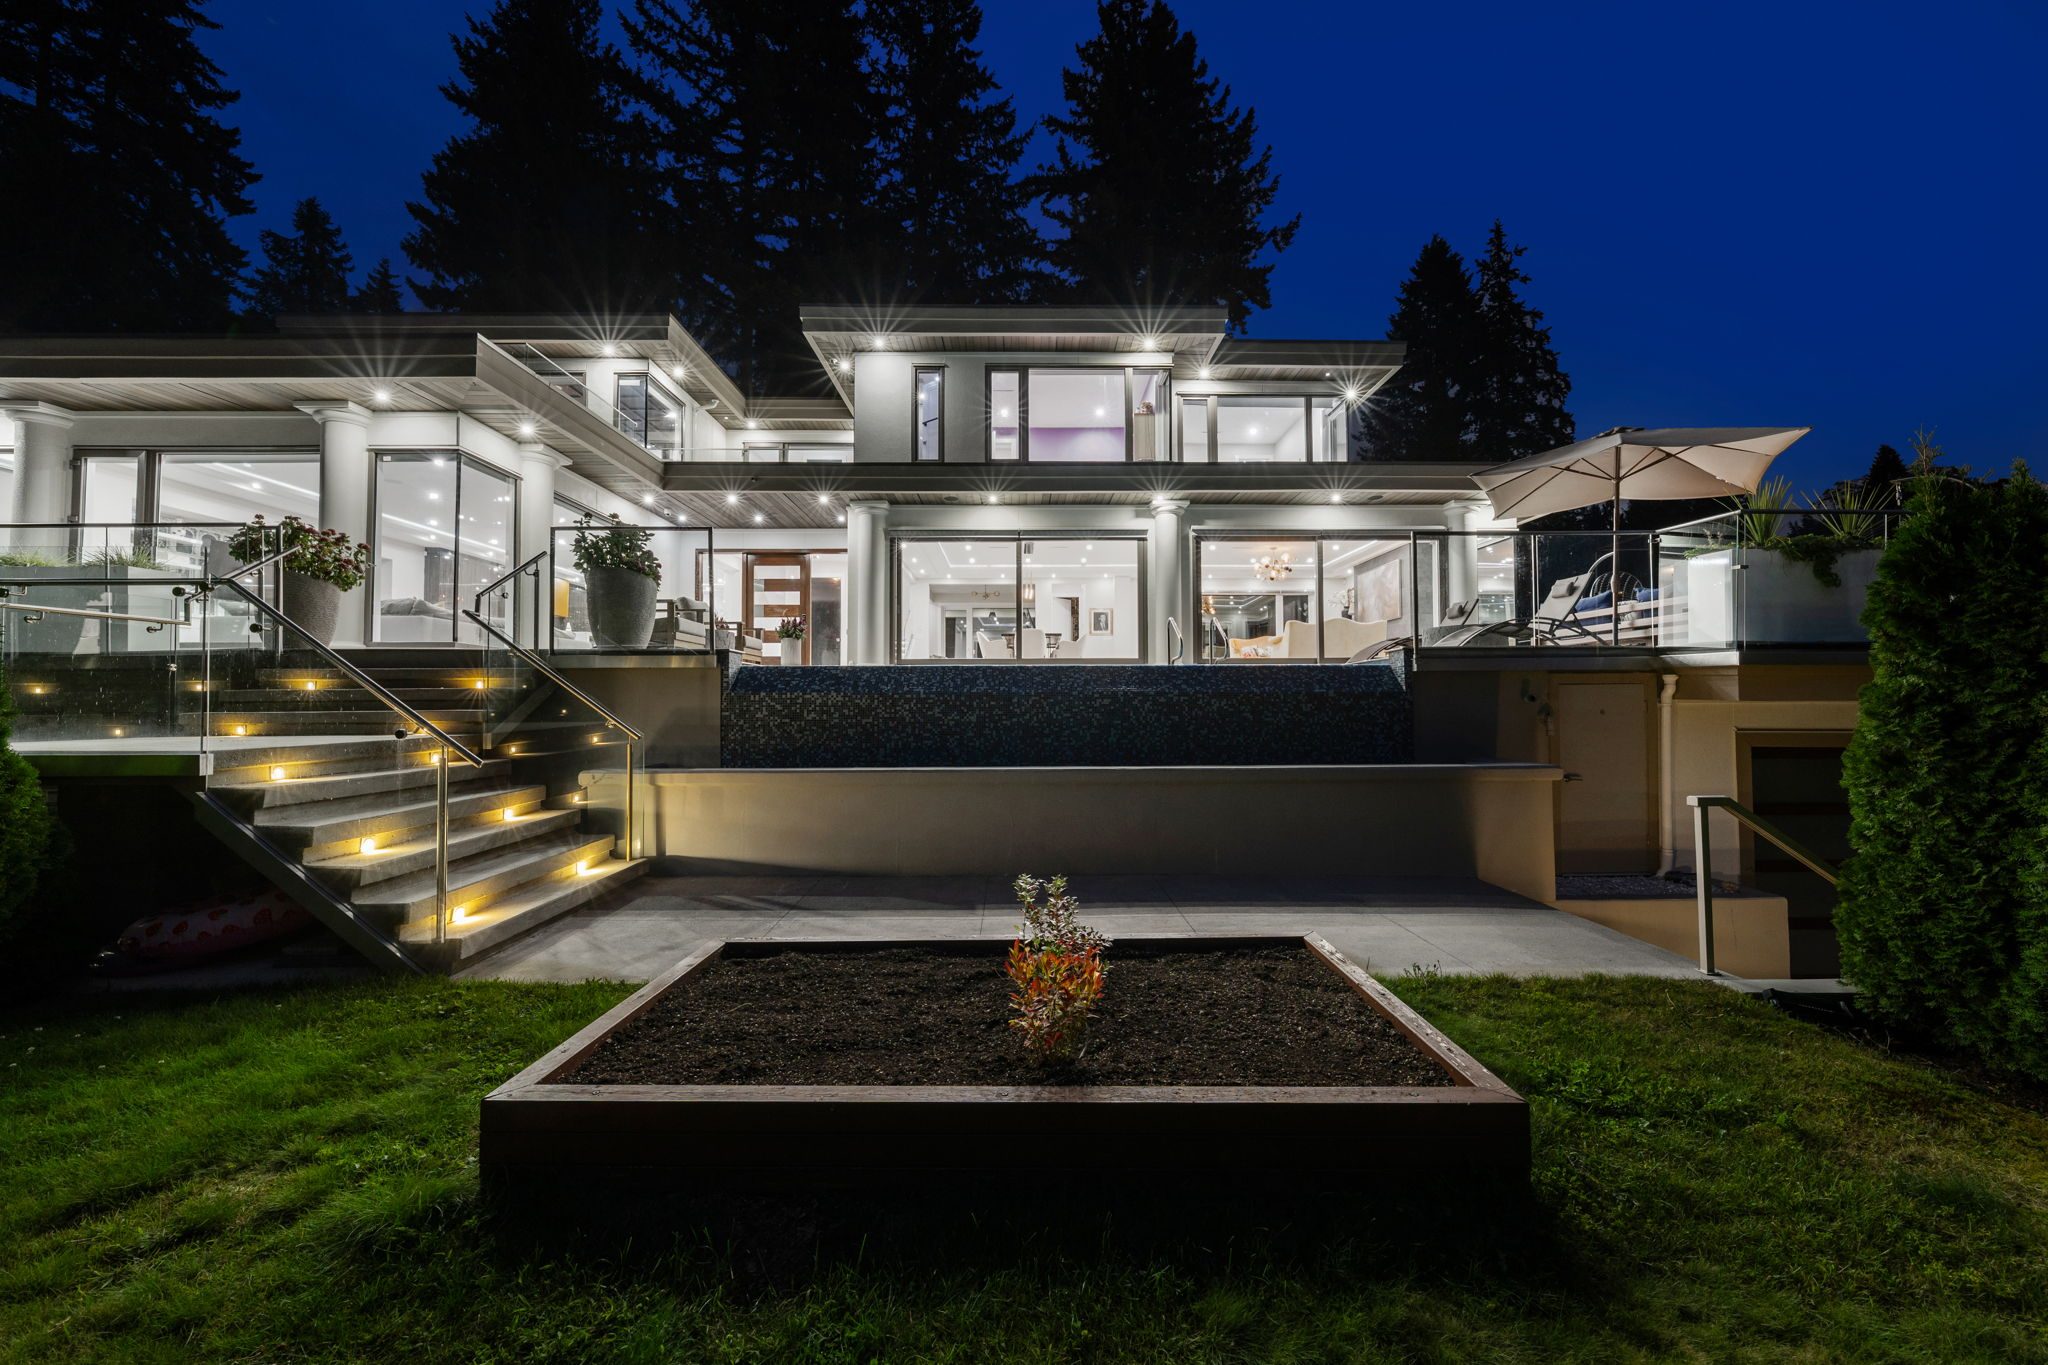
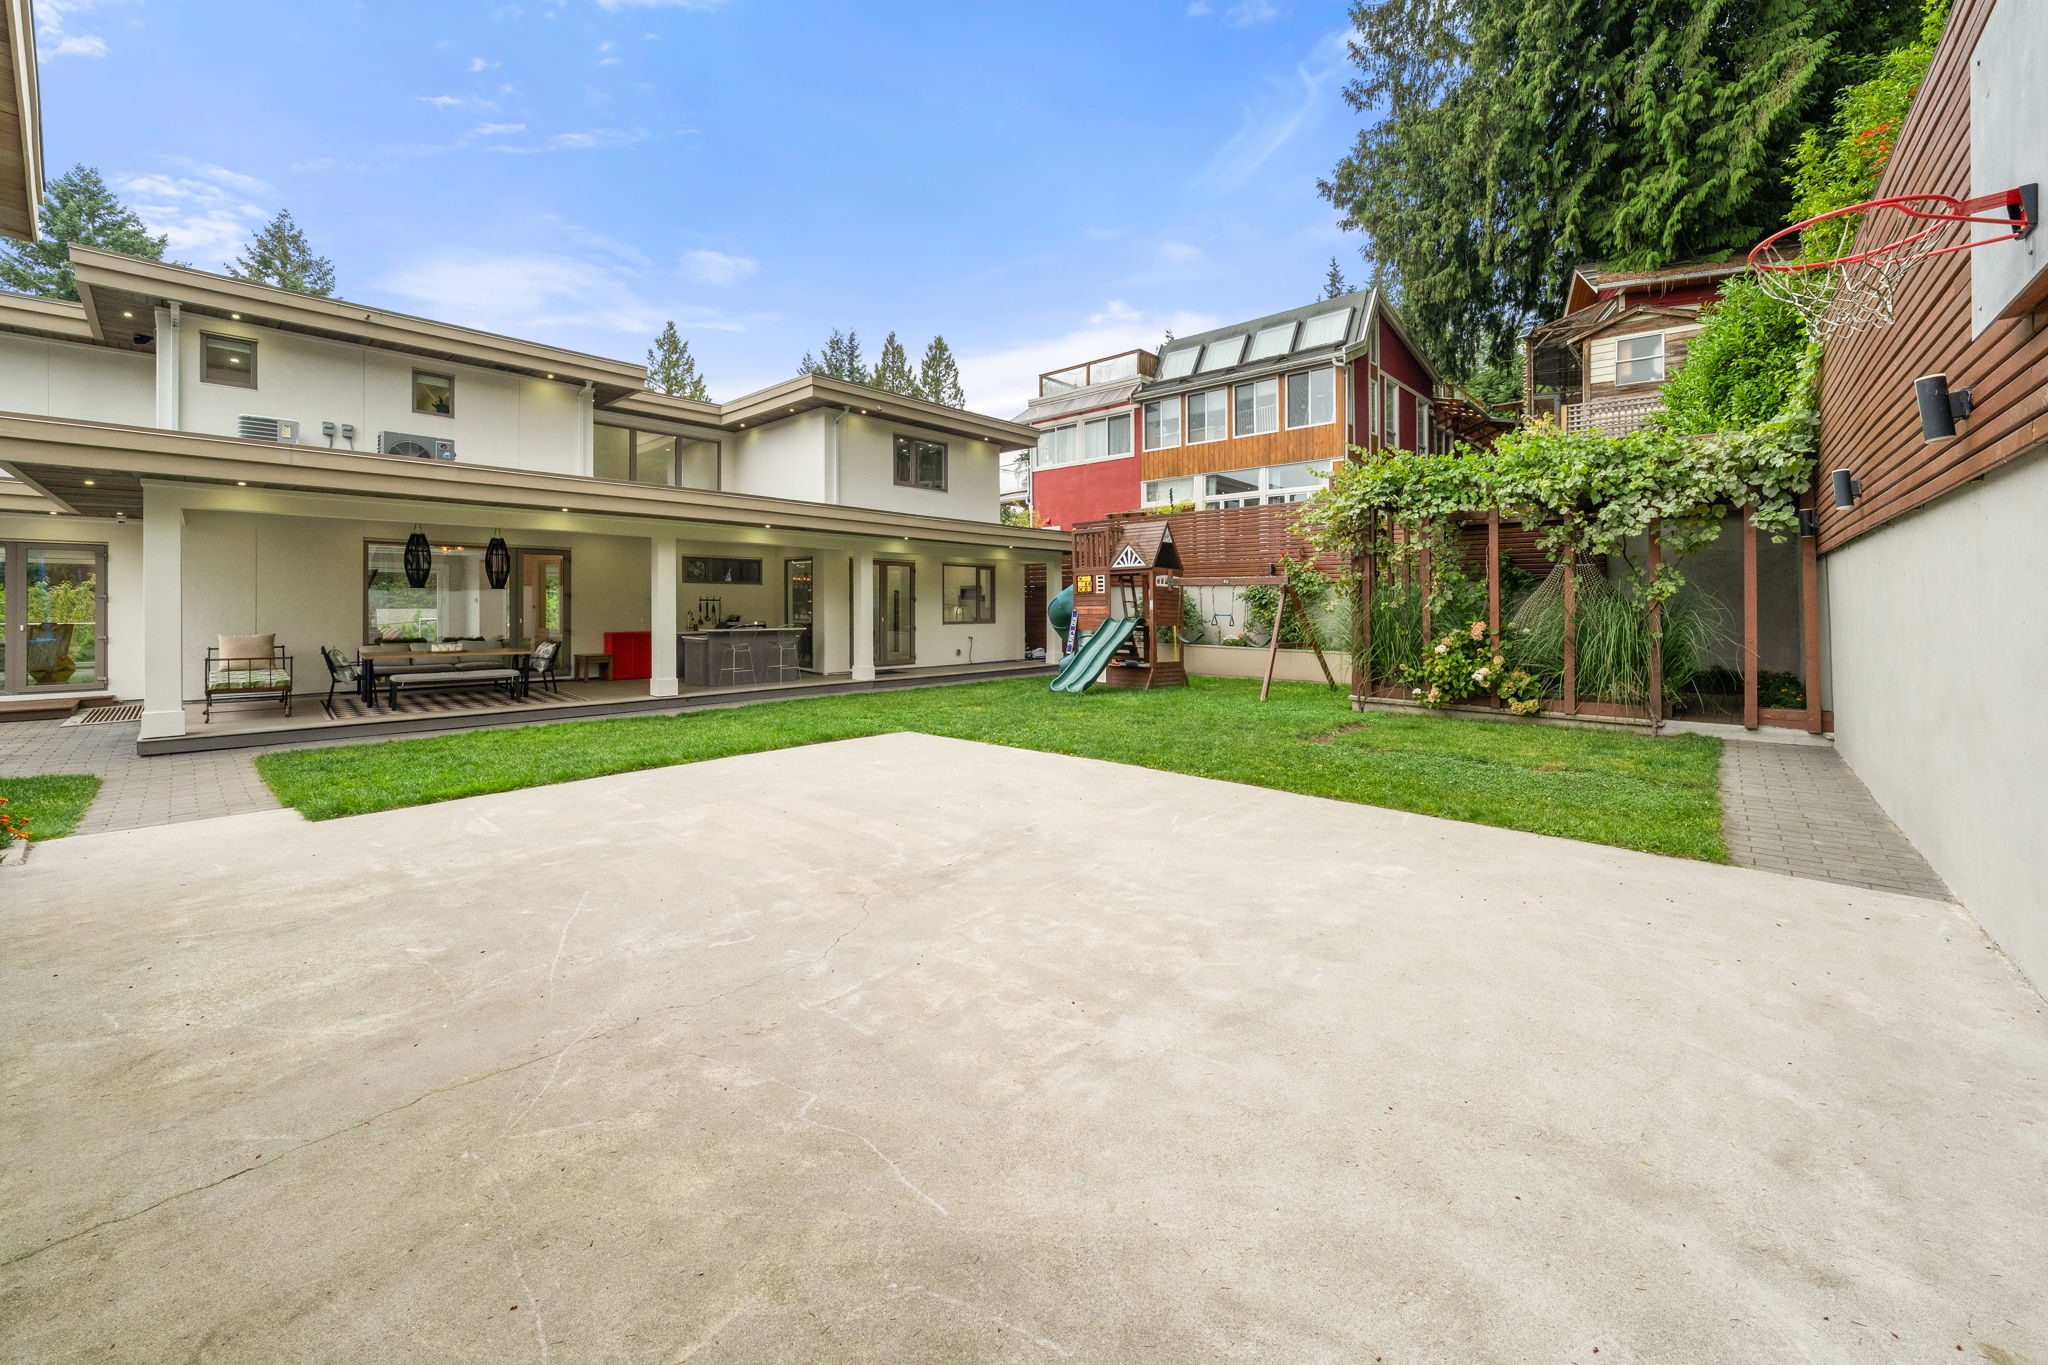
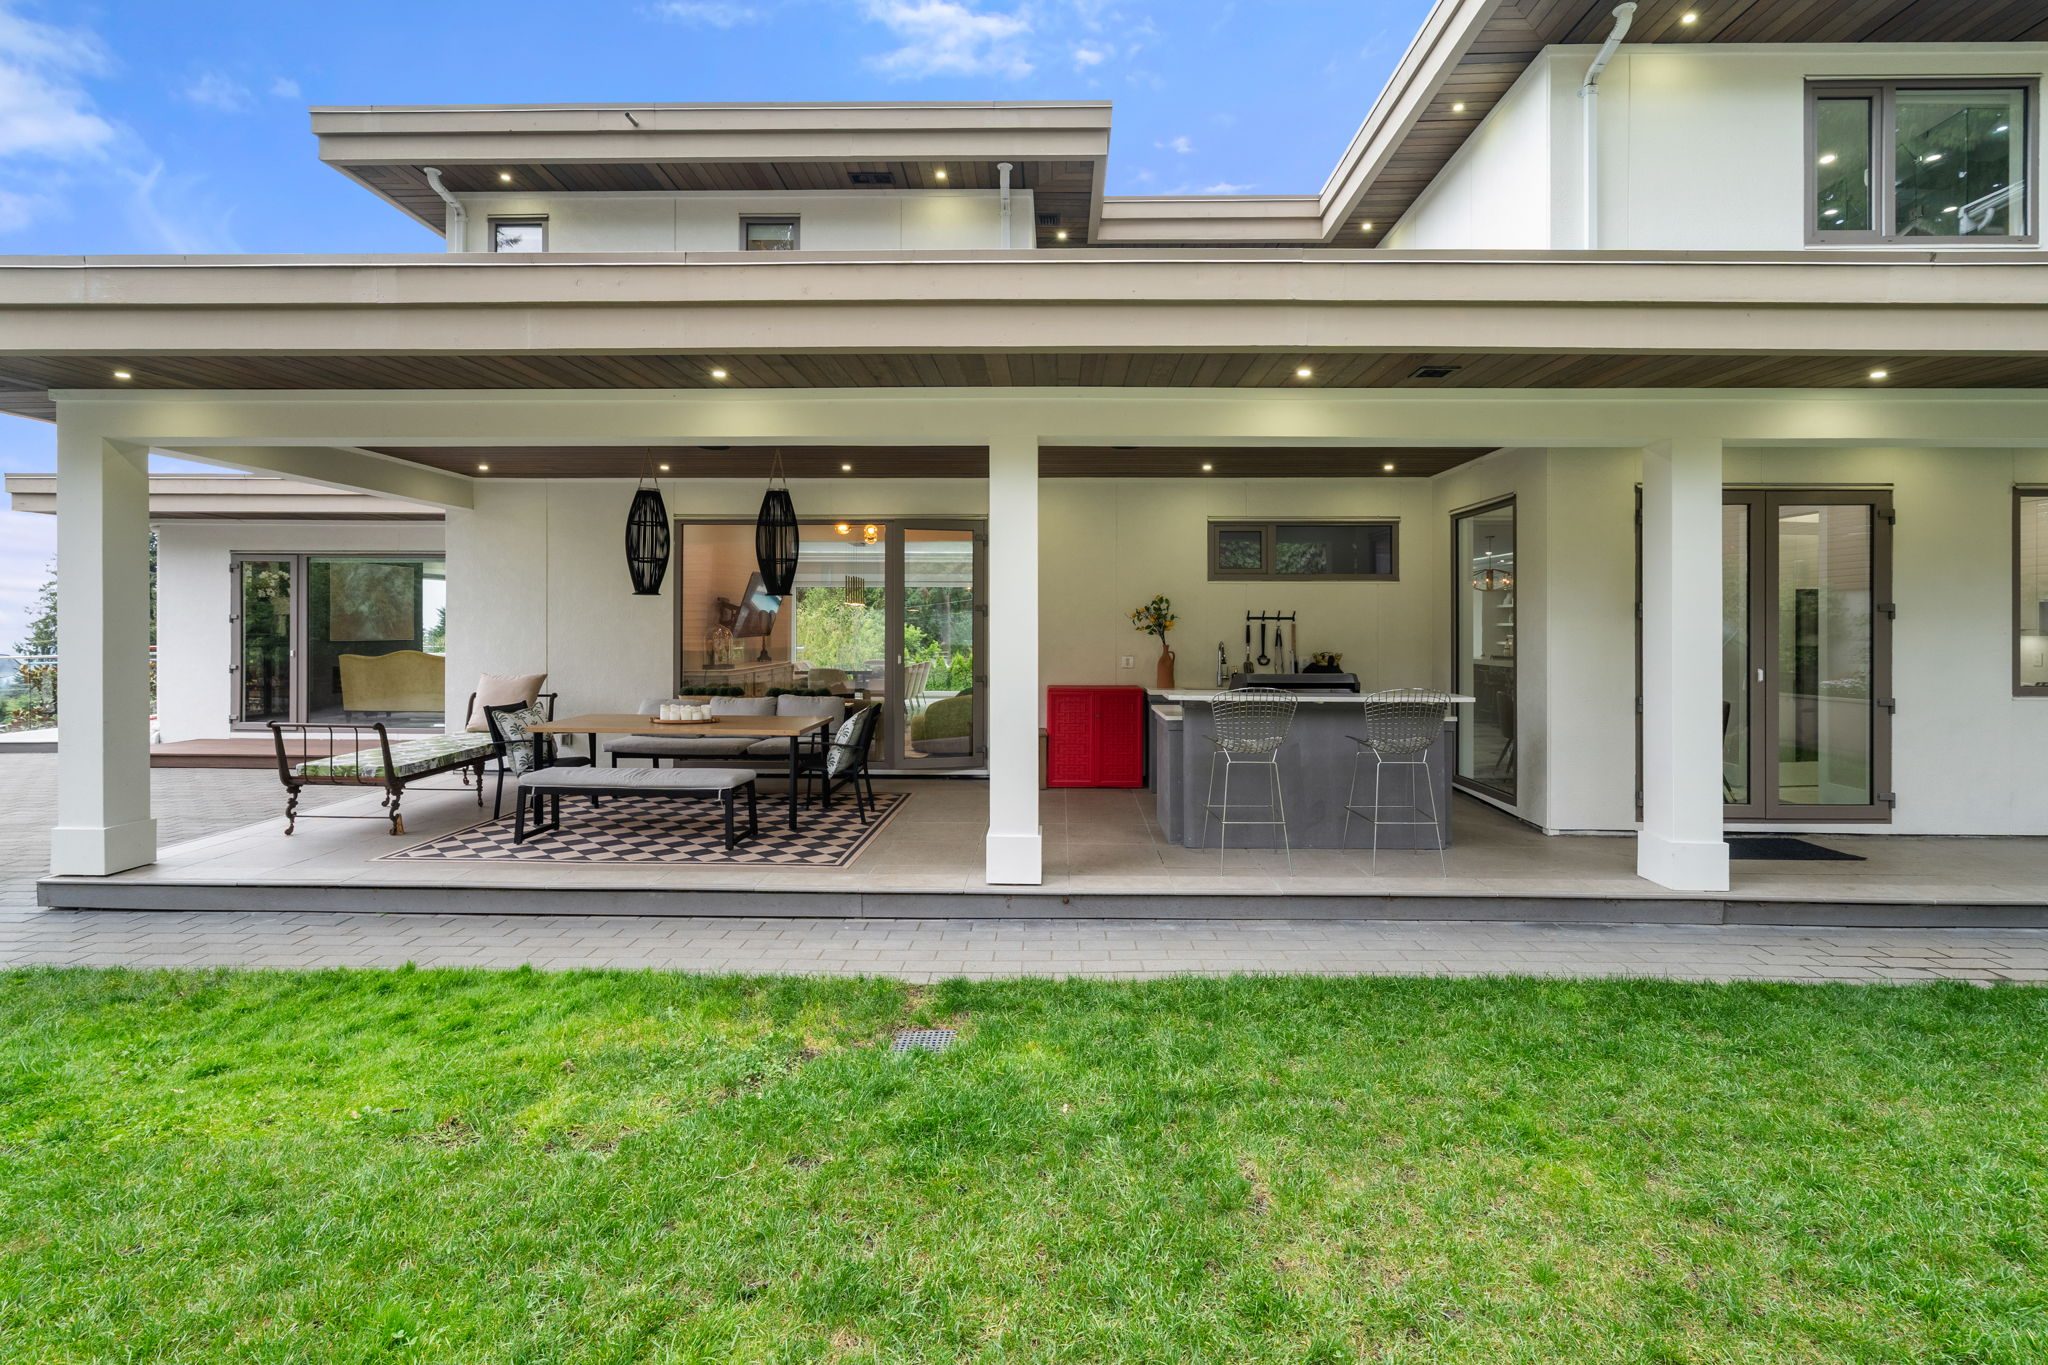
| Bedrooms | 6 |
| Bathrooms | 10 |
| Living Area | 7,010 sqft |
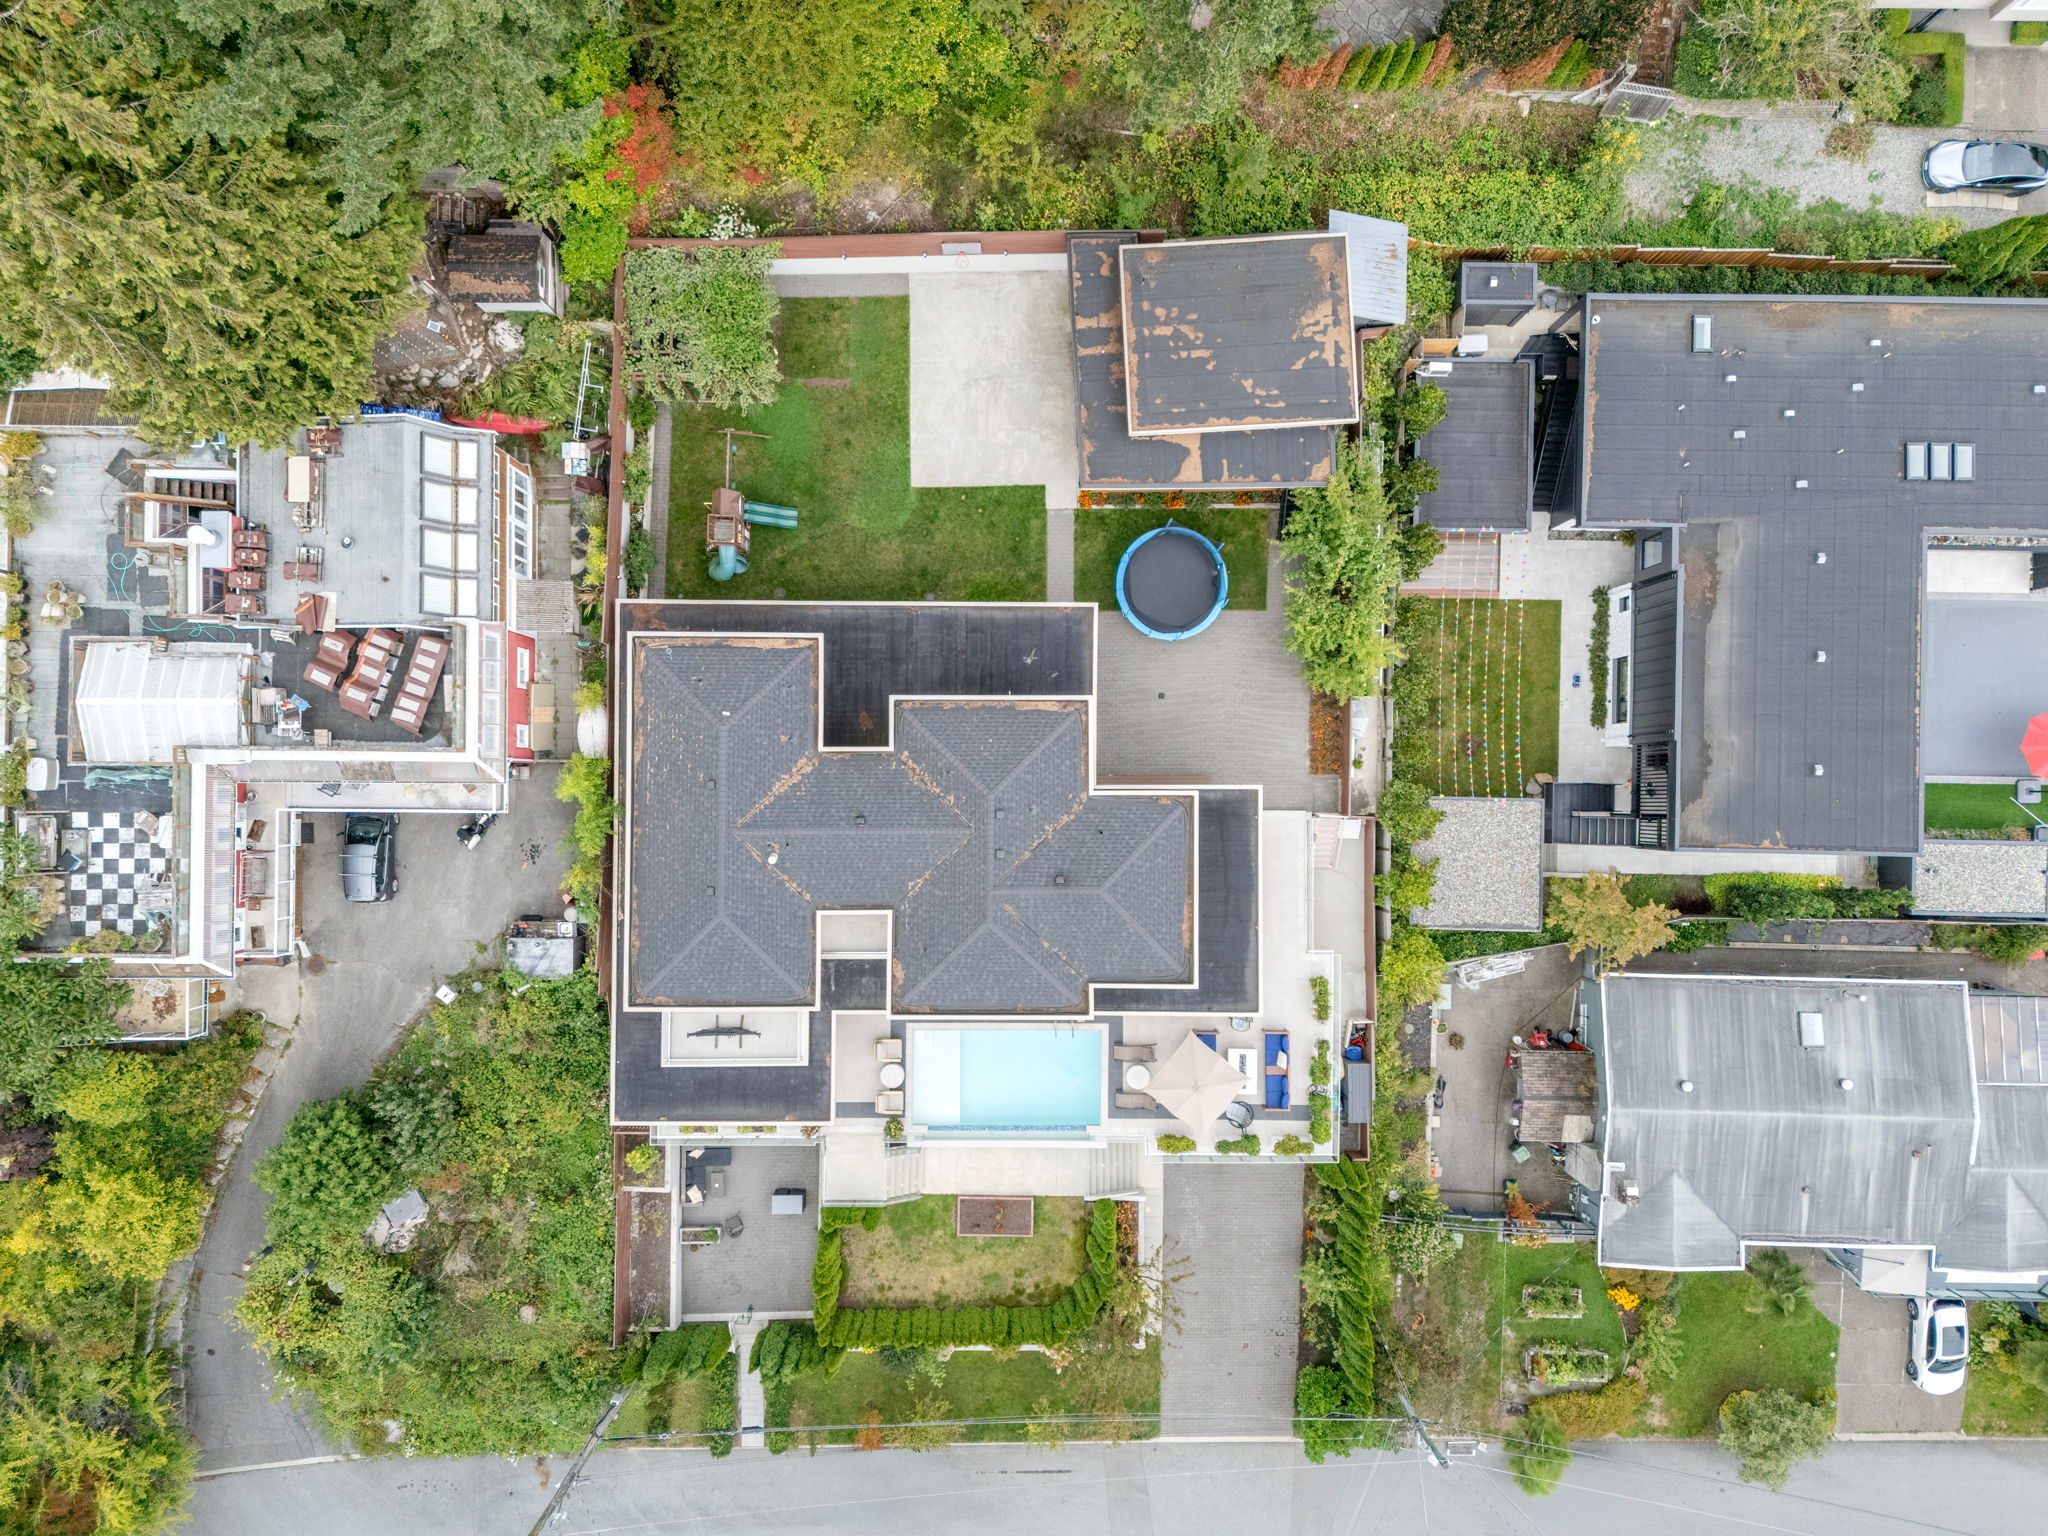
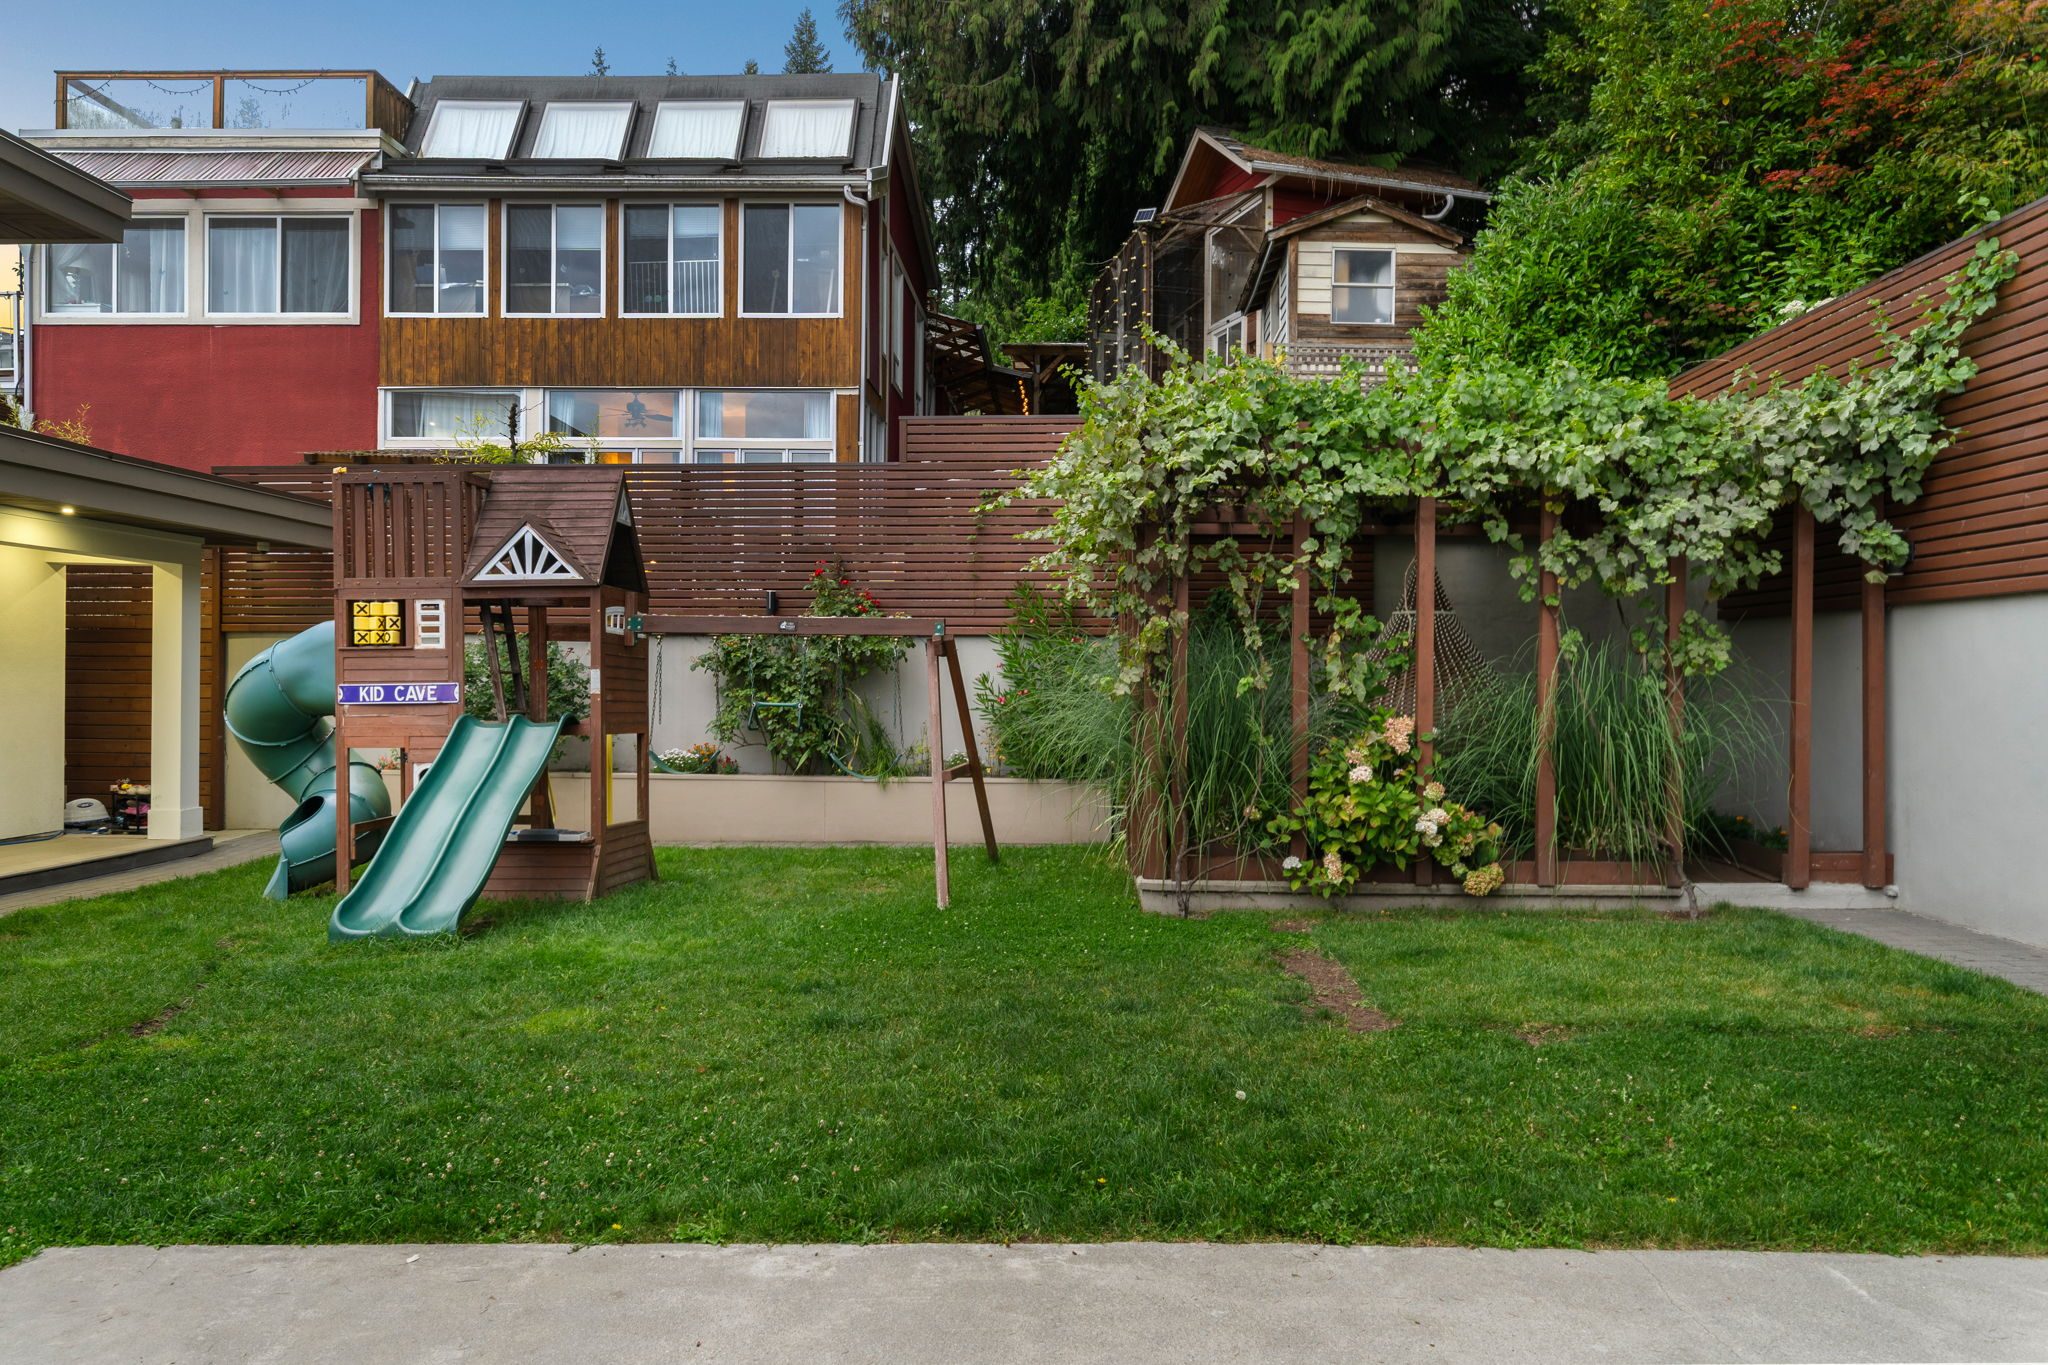
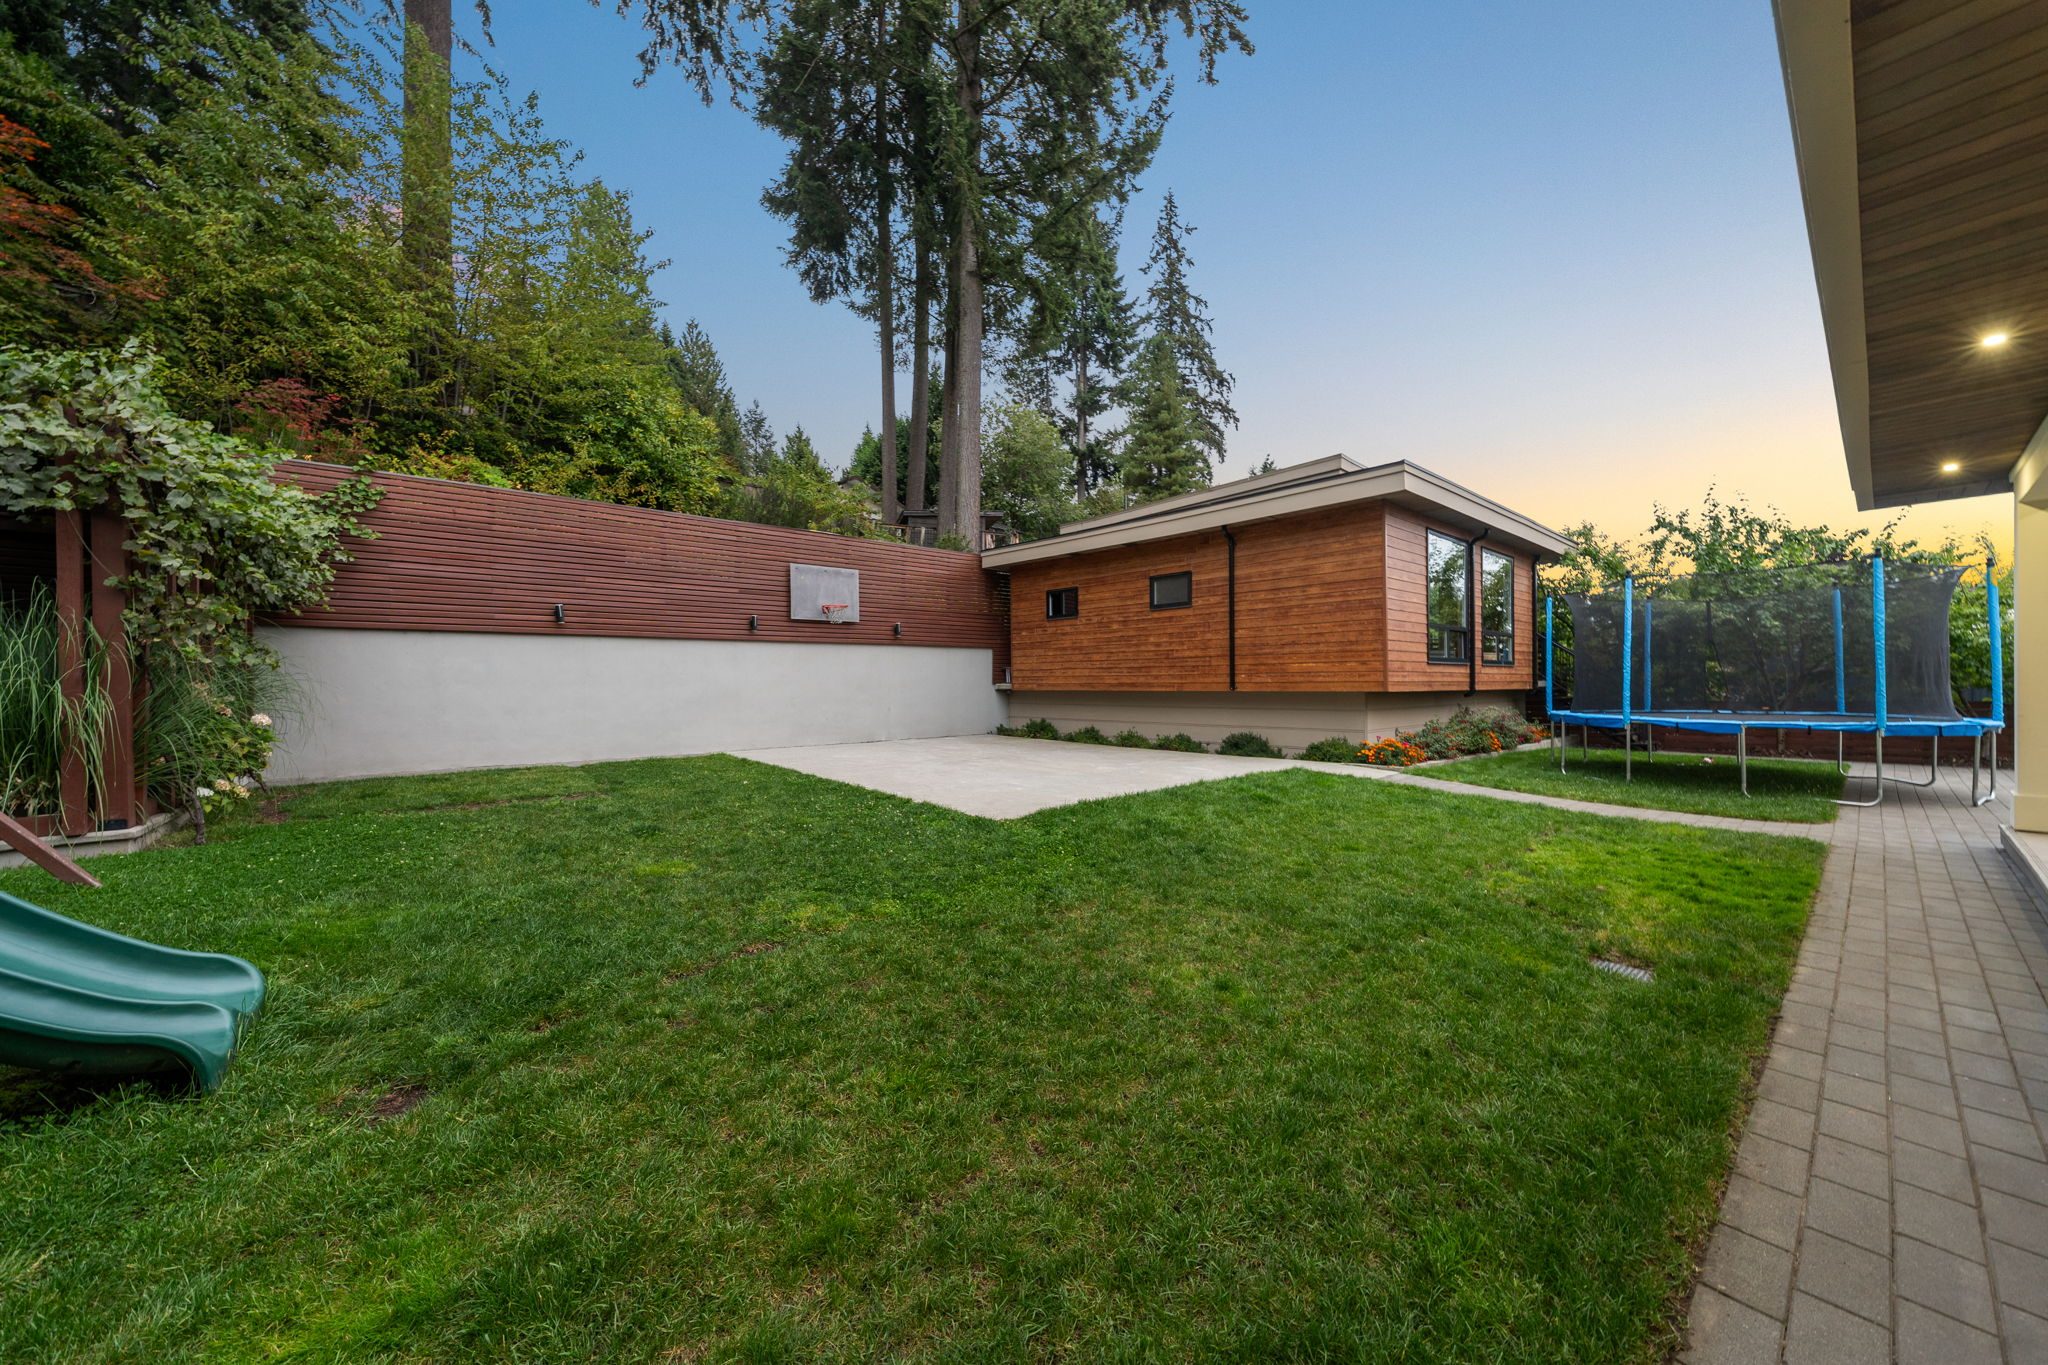
| Lot Size | 14,248 sqft |
| Property Type | Single Family Residence |
| MLS® # | R3180854 |
Upper Lonsdale · North Vancouver · All Homes
| Active Properties | All Active | This Property |
|---|---|---|
| All Homes | 73 | |
| Median Asking Price | $ 1,988,800 | $ 5,999,000 |
| Median Price per SqFt | $773 | $856 |
| Median Days on Market | 58 |
| Sold Properties | Nov 2026 | Oct 2026 | Nov 2025 |
|---|---|---|---|
| All Homes | 4 ▼20.0% | 7 | 5 |
| Median Selling Price | $ 2,030,000 ▲14.6% | $ 1,870,000 | $ 1,772,000 |
| Median Price per SqFt | $747 ▲4.2% | $716 | $717 |
| Median Days on Market | 37 | 19 | 43 |
| Median Discount Off Ask | 6.3% | 3.9% | 9.1% |
| New Listings | 9 | 18 | 4 |
| Months of Inventory | 8.0 |
At the current sales pace, it would take about 8 months to sell all the homes currently for sale here — a Balanced market.
Homes for sale and active buyers are fairly evenly matched, so neither side has a clear advantage.
Months of inventory = the number of homes currently for sale ÷ the average number sold per month recently. As a rule of thumb, under 5 months favours sellers, 5–8 is balanced, and over 8 favours buyers.
Aggregate market statistics from the MLS® for Upper Lonsdale. Figures are medians and may reflect small sample sizes in a single neighbourhood. Not an appraisal — ask a team member to verify.