PHONE: 604-925-1175
|
EMAIL:
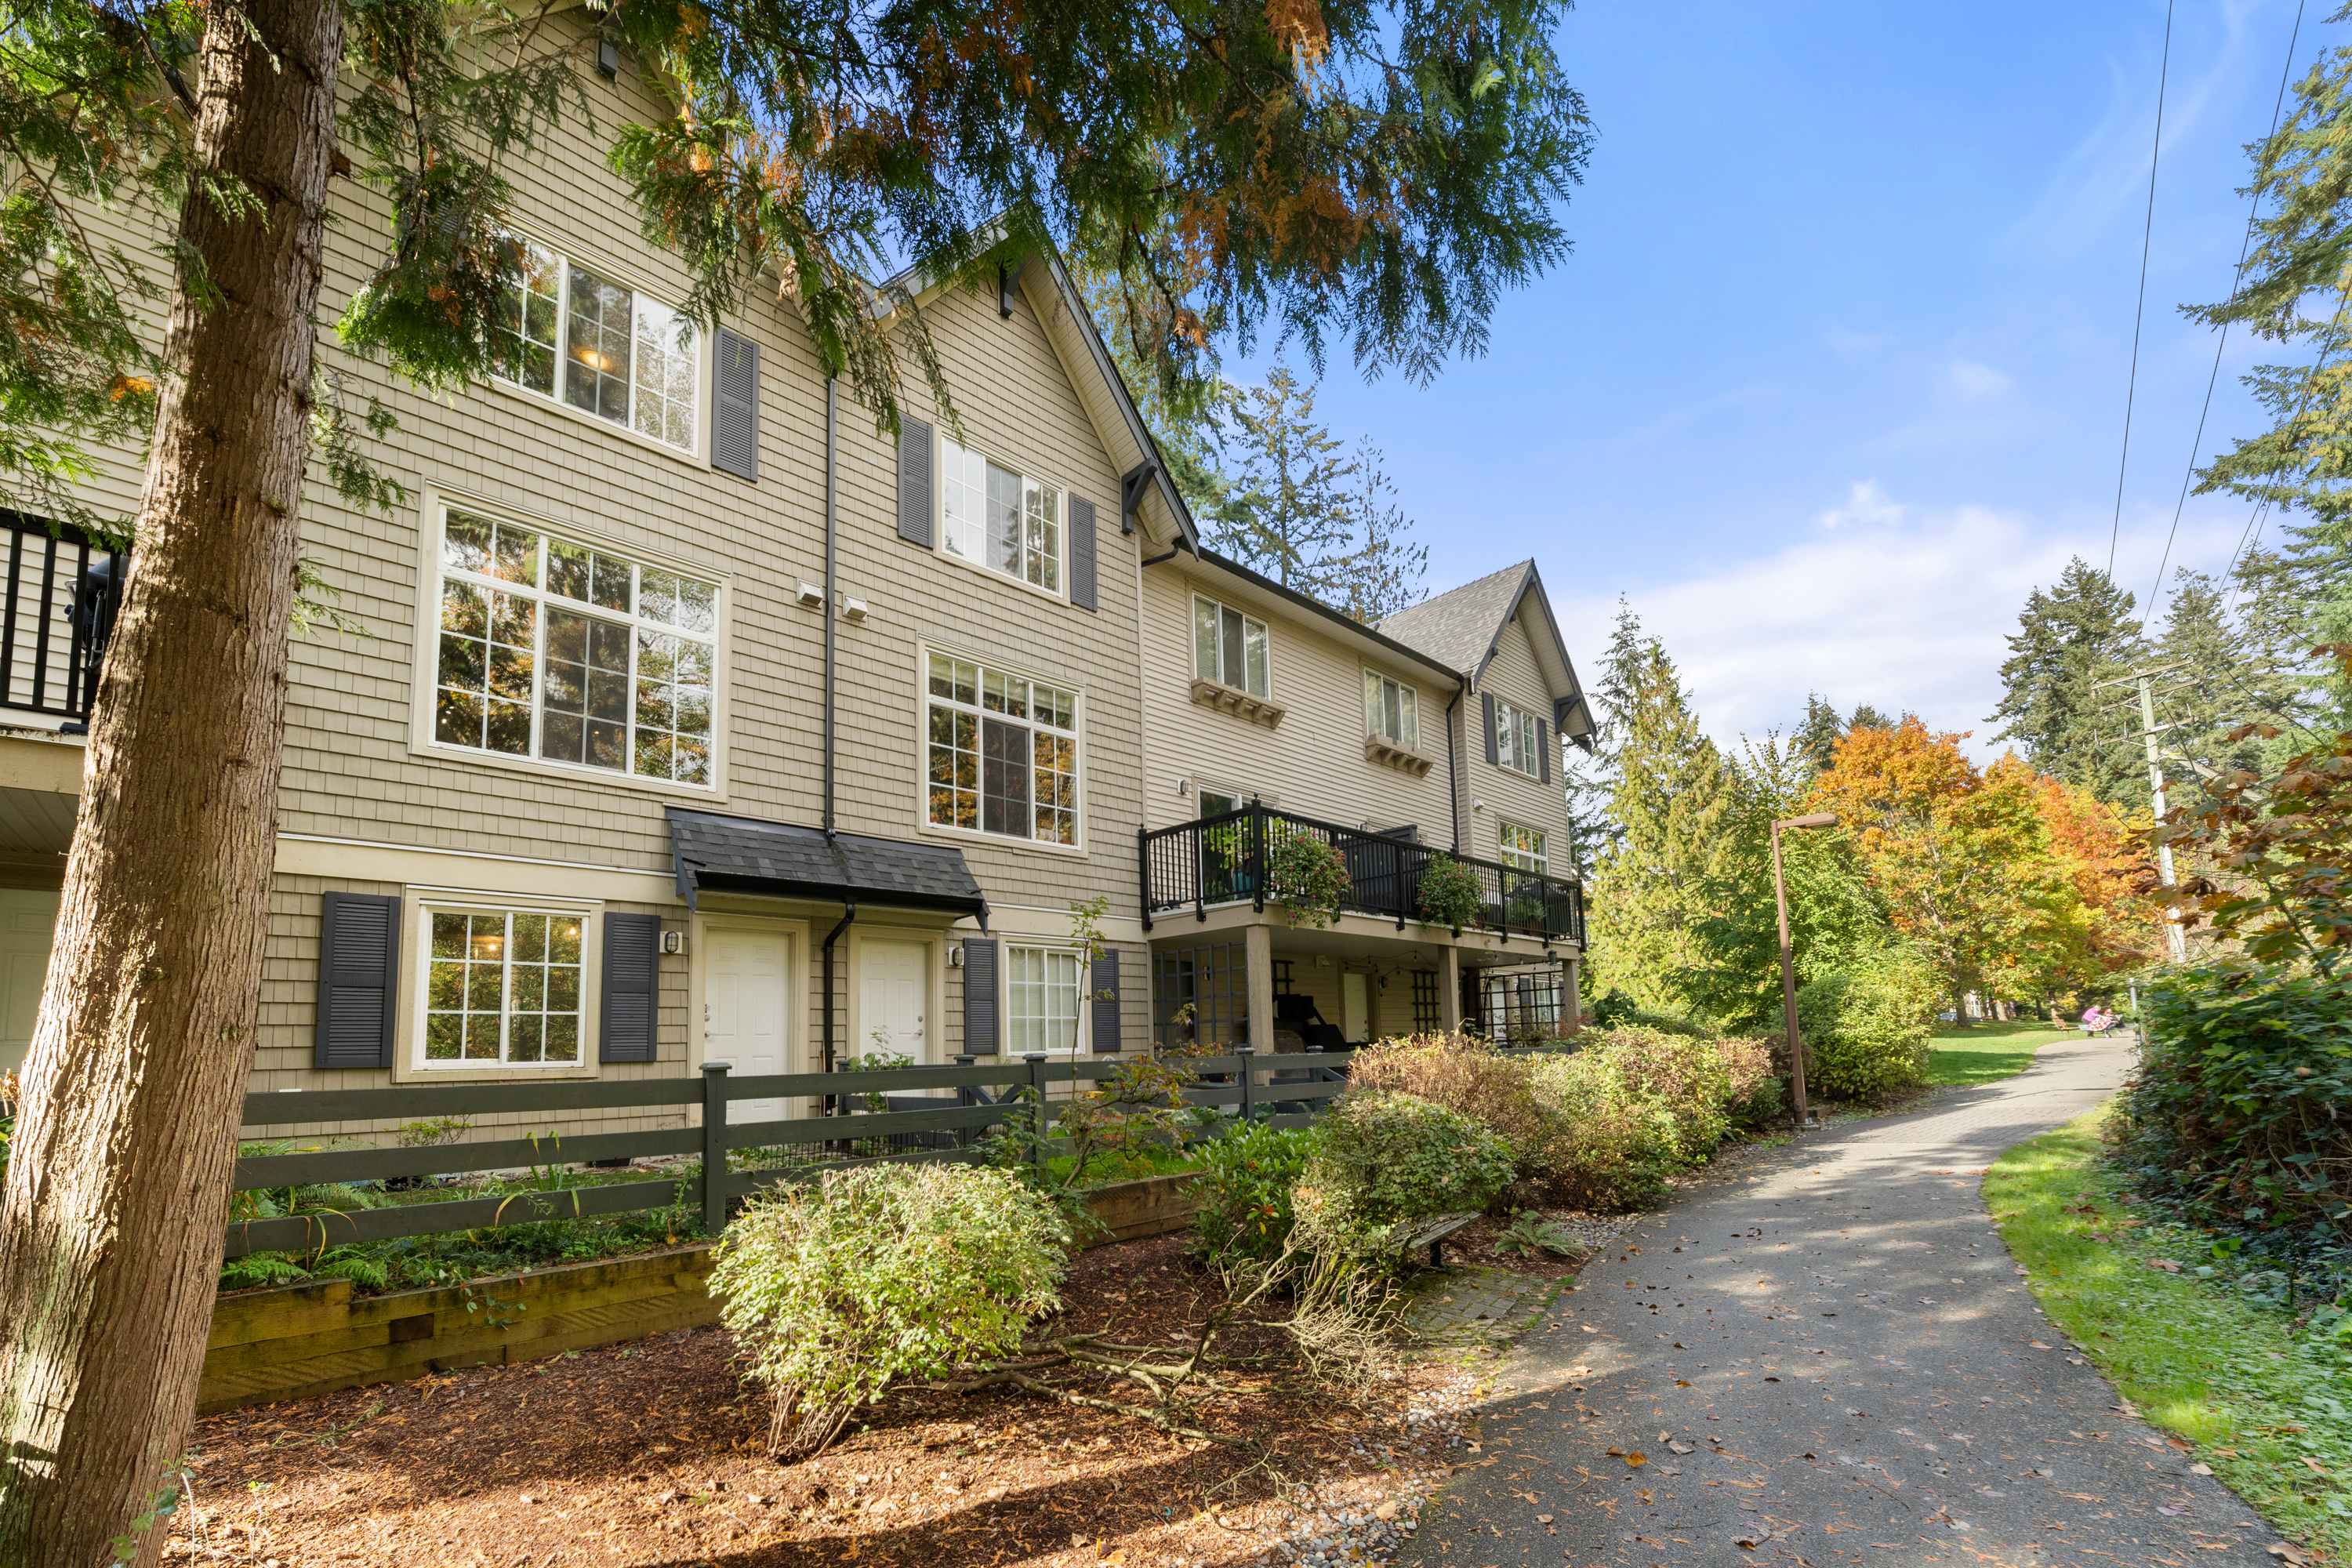
| Bedrooms | 2 |
| Bathrooms | 2 |
| Living Area | 1,328 sqft |
| Property Type | Residential Attached |
| MLS® # | R2938114 |
Create a free account to see this property's sold price.
Sold price history is provided under our real estate board's data licence. Registration is three quick steps: your details, the board's terms of use, and a confirmation email. Access then runs for 30 days and is renewable.
Sign in and your access to sold prices is restored right away — no need to register again.
Seymour NV · North Vancouver · Houses
| Active Properties | All Active | This Property |
|---|---|---|
| Houses | 5 | |
| Median Asking Price | $ 1,269,000 | $ 1,259,000 |
| Median Price per SqFt | $838 | $948 |
| Median Days on Market | 32 |
| Sold Properties | Oct 2026 | Sep 2026 | Oct 2025 |
|---|---|---|---|
| Houses | 0 ▼100.0% | 1 | 2 |
| Median Selling Price | – ▼100.0% | $ 1,245,000 | $ 1,239,950 |
| Median Price per SqFt | – ▼100.0% | $928 | $841 |
| Median Days on Market | – | 35 | 17 |
| Median Discount Off Ask | – | 1.9% | 0.7% |
| New Listings | 0 | 4 | 4 |
| Months of Inventory | 3.8 |
At the current sales pace, it would take about 4 months to sell all the homes currently for sale here — a Seller's market.
Homes are selling faster than new ones come up, so sellers tend to have the upper hand and buyers face more competition.
Months of inventory = the number of homes currently for sale ÷ the average number sold per month recently. As a rule of thumb, under 5 months favours sellers, 5–8 is balanced, and over 8 favours buyers.
Aggregate market statistics from the MLS® for Seymour NV. Figures are medians and may reflect small sample sizes in a single neighbourhood. Not an appraisal — ask a team member to verify.